Argon gas discharge lamp: Difference between revisions
| (130 intermediate revisions by 3 users not shown) | |||
| Line 5: | Line 5: | ||
==Setup== | ==Setup== | ||
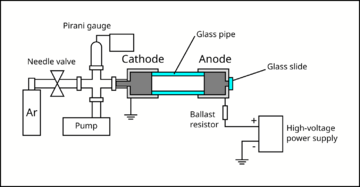
A small air-tight chamber was evacuated with a | A small air-tight chamber was evacuated with a rotary vane pump to about <math>3\times10^{-3}</math> Torr (measured with a Pirani gauge). Then, Argon gas was slowly introduced to the chamber via a needle valve, until the chamber reached the pressure of about <math>10^{-1}</math> to <math>10^0</math> Torr. The metallic cylinder that interfaces with the gas lines forms the cathode of the chamber, and is grounded. Another metallic cylinder (anode) was attached to the cathode using a glass pipe. | ||
[[File:Argon-lamp-schematics.png|360px|Schematics for the Argon gas discharge lamp setup]] | |||
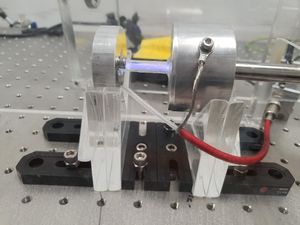
The glass pipe provides an electrical isolation between the cathode and the anode, and provides a viewport for the experimenter to observe glow discharge. The anode was connected to the positive terminal of a high-voltage power supply, which can reach upto 760 V. Epoxy was used to connect the pieces and seal the vacuum chamber. A ballast resistor (33 kΩ) was added in series with the gas discharge lamp in order to limit the current. The electrodes were mechanically held using laser-cut acrylic plates fixed to an optical breadboard using brackets and bolts. Multimeters were used to monitor the current and the voltage across the lamp. | The glass pipe provides an electrical isolation between the cathode and the anode, and provides a viewport for the experimenter to observe glow discharge. The anode was connected to the positive terminal of a high-voltage power supply, which can reach upto 760 V. Epoxy was used to connect the pieces and seal the vacuum chamber. A ballast resistor (33 kΩ) was added in series with the gas discharge lamp in order to limit the current. The electrodes were mechanically held using laser-cut acrylic plates fixed to an optical breadboard using brackets and bolts. Multimeters were used to monitor the current and the voltage across the lamp. | ||
Additional details: | |||
* <b>Electrodes:</b> The electrodes were made by boring a hole through the centre of a cylindrical piece of aluminium(?) using a lathe. By facing the surfaces and cutting out the corners at 45 degrees angle, sharp edges were minimised to reduce charge leakage through corona discharge. | |||
* <b>Glass pipe:</b> The glass pipe was cut from a longer piece of quartz glass pipe. | |||
* <b>Vacuum fittings:</b> The cathode is connected to a metal pipe attached to a KF blank flange with a hole. The rest of the vacuum fittings are connected via rubber o-rings and clamps. | |||
* <b>High-voltage probe:</b> The high-voltage of the anode was measured with a voltage divider (1:1000) probe, connected to a multimeter. | |||
[[File:Argon-lamp-setup.jpeg|thumb|Argon gas discharge lamp setup]] | [[File:Argon-lamp-setup.jpeg|thumb|Argon gas discharge lamp setup]] | ||
==Measurements== | ==Measurements== | ||
The chief advantage of our setup is the capability to adjust the pressure of the Argon gas. | The chief advantage of our setup is the capability to adjust the pressure of the Argon gas. | ||
As such, our measurements focus on breakdown voltages, extinction voltages, and I-V characterestics of the glow discharge, at various pressures. | |||
===Important parameters about plasma=== | |||
*<b>Debye Length</b> | |||
When applying an electric field in the plasma, the charged particles will react to reduce the effect of the field. Whenever the plasma had an extra number of positive or negative particles, this part of particles would create an electric field and the electrons will move to cancel the charge. The response of this reduction effect of the electric fields is Debye shielding, which gives the plasma its quasi-neutrality characteristic. Based on this, the concentration of charged particles near two electrodes will shield the charged surfaces from the bulk. The applied electrical potential will develop mostly near the plates over some distance, which is called Debye Length. | |||
<math display="block">\lambda_{D}=(\frac{\epsilon_{0}k_{B}T_{e}}{n_{e}e^2})^{\frac{1}{2}}</math> | |||
where <math>n_e</math> is the density of electrons, <math>e</math> electron charge, <math>\epsilon_{0}</math> is permittivity of free space, <math>k_{B}</math> is the Boltzmann constant and <math>T_{e}</math> is the electron temperature(<math>eV</math>). | |||
*<b>Plasma Frequency</b> | |||
When the electrons move under force of electric field from the charge balance, they respond to the fields and accelerate. As a result, the oscillatory motion is executed. These oscillations have the so called plasma frequency, and it could be expressed as: | |||
<math display="block">\omega_{pe}=\sqrt{\frac{e^{2}n_{e}}{\epsilon_{0}m_{e}}}</math>. | |||
*<b>Mean Free Path</b> | |||
When the atoms are moving, they could collide with other atoms. Between the collisions, we suppose that the atoms travel in a straight line. Since the atoms are randomly distributed, each one moves with different velocities and their travel distances between two collisions could be averaged as the mean free path, which could be expressed as: | |||
<math display="block">\lambda_{m}=\frac{1}{\sqrt{2}\sigma_{c}n_{g}}</math>. | |||
where <math>\sigma_c</math> is cross section of the atom and <math>n_g</math> is the density of the plasma. | |||
===Glow Discharge=== | ===Glow Discharge=== | ||
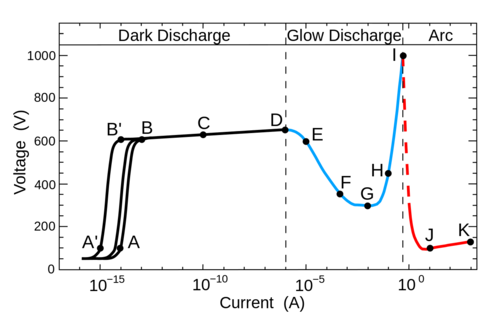
The figure is from [https://en.wikipedia.org/wiki/Glow_discharge glow discharge].A-D region, F-H region and I-K region separately represent the dark discharge, glow discharge and arc discharge region. | |||
[[File:Current-voltage curve.png|640px|thumb|500px|I-V curve of electrical discharge in neon at 1torr, with two planar electrodes separated by 50cm]] | |||
*In a dark discharge, the carriers are generated during the inonization process by a radiation sorce. The voltage is applied across the anode and cathode.At higher voltage, the freed carriers could obtain enough energy so that additional carriers are freed during collisions. | |||
*In glow discharge, the carrier generation process reaches a point where the average electron leaving the cathode allows another electron to leave the cathode. | |||
*In an [https://en.wikipedia.org/wiki/Electric_arc arc discharge], electrons leave the cathode by [https://en.wikipedia.org/wiki/Thermionic_emission thermionic emission] and [https://en.wikipedia.org/wiki/Thermionic_emission field emission], and the gas is ionized by thermal means. | |||
[[File:Glow structure.png|540px|thumb|500px|Glow discharge structure.png]] | |||
We also attach a diagram here to illustrate the distributions of some physics quantities regarding the plasma. <ref>Fuad T.I.(2013) Design and Construction of low-Pressure D.C.-Sputtering plasma system for preparing Gas Sensors. University of Baghdad.</ref>)In our project, we mainly studied the property and characteristics within the glow discharge region, given the limitation of the supplies and pump we had. The figure shows the names of different glowing regions in the Argon as well as the graphs showing the variation of the potential(<math>V</math>), electric field(<math>E</math>), current density(<math>n</math>) along the tube. In our case, the distance between the cathode and anode (<math>d</math>) is 3.164cm. | |||
Generally, the plasma at the region of glow discharge has the following properties: | |||
*The plasma is highly ionized and has good electrical and thermal conductivity. It has a specific heat capacity hundreds of times larger than ordinary gases. | |||
*Positively and negatively charged particles have almost equal densities. | |||
*Macroscopically it is neutral. | |||
*It has glow feature, the average kinetic energy of the electron is much higher than that of the other particles, so it's not in equilibrium. | |||
We qualitatively observe the changes in the spectroscopic properties in the stable DC Argon plasma, as we vary the pressure. | We qualitatively observe the changes in the spectroscopic properties in the stable DC Argon plasma, as we vary the pressure. | ||
The colours of the glow shifts from pink, to purple, to pale blue, as the pressure increases from approxmiately 0.03 Torr to 3 Torr. | |||
{| class="wikitable" style="margin:auto" | |||
|+ Colour changes in glow discharge with varying pressure | |||
|- | |||
! Pressure (Torr) !! Video Frame | |||
|- | |||
| 0.03 || [[File:Argon-lamp-glow-ss1.jpg|360px|Glow discharge colour change at 0.03 Torr]] | |||
|- | |||
| 0.3 || [[File:Argon-lamp-glow-ss2.jpg|360px|Glow discharge colour change at 0.3 Torr]] | |||
|- | |||
| 3 || [[File:Argon-lamp-glow-ss3.jpg|360px|Glow discharge colour change at 3 Torr]] | |||
|} | |||
[[File:Argon-lamp-glow-compressed.mp4|thumb|Glow discharge colour change]] (download to view) | |||
In the glow discharge, the pressure appiled could be related with the mean free path of the Argon atoms. Higher pressure means the shorter mean free path. Consider the situation of the constant voltage, so that the constant elecrical field between the cathode and anode in our project, shorter mean free path allows a charged particle to gain less energy before colliding with another article. So that as the pressure goes up, we get a bluer light which means the less energy. | |||
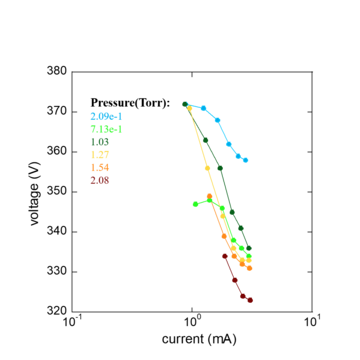
[[File:I-V_curve.png|540px|360px|I-V curve of Argon under various pressures]] | |||
Here the voltage is all larger than the breakdown voltage in the backward direction. Because of the existance of the hysteresis effect, the breakdown voltage which igniting the plasma is different from the value by which the glow plasma extincts. This is discussed below in the hysteresis part. We obtain this curve by first igniting the plasma with the application of the laser high-voltage supply and set the voltage supply to its upper limit. Then we change the voltage at the supply and measure the I-V data points of between the anode and cathode till the plasma extincts. And we repeat the measurement under different pressures. | |||
Although the ranges of current and voltage are both limited here, we still get a I-V curve whose trend correspond with the normal glow distribution part quite well.<br> | |||
Regarding the relationship between the pressure and the value of the breakdown voltage, which is close to the lower limit of each I-V curve here, from the figure, what we can learn is that generally, the higher pressure the plasma is under, the lower the breakdown voltage will be.However, because of the limited number of data points we have, we cannot get an accurate prediction of the related parameters here. Next, we would introduce a method which could efficiently measure the parameters about the plasma. | |||
<b>Langmuir probe</b> | |||
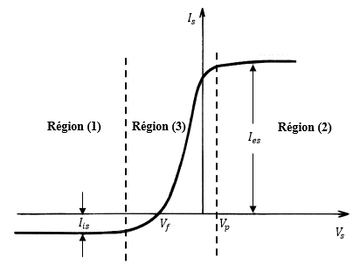
<br>[https://en.wikipedia.org/wiki/Langmuir_probe Langmuir probe] is a devices used to determine the electron temperature, electron density and electric potential of a plasma. It works by inserting one or more electrodes into a plasma. We get the I-V characteristic curve by measuring the current through it and voltage between it and the anode. | |||
[[File:Probe.png|360px|thumb|Typical Langmuir I-V curve]] | |||
For the region 3 of the I-V curve, since the electrons are subjected to a decelerating potential <math>(V_{p}-V_{f})</math>, only the electrons with higher energy than <math>e(V_{p}-V_{f})</math> can reach the probe. If we assume that the velocities of electrons in plasma obey [https://en.wikipedia.org/wiki/Maxwell%E2%80%93Boltzmann_distribution Maxwell-Boltzmann distribution], then the electron density <math>n_{e}</math>near the probe could be described as, | |||
<math display="block">n_{e}=n_{0}exp[\frac{e(U_{p}-U_{s})}{kT_{e}}]</math> | |||
where <math>n_{0}</math> is the electron density in plasma, <math>T_{e}</math> is the electron temperature, <math>k</math> is the Boltzmann constant. <br> | |||
If the average velocity of electron is <math>v_{e}</math>, then the number of electrons position at the probe of the area <math>S</math> will be: | |||
<math display="block">N_{e}=\frac{1}{4}n_{e}v_{e}S</math> | |||
Then we could get the current as: | |||
<math display="block">I=N_{e}e=\frac{1}{4}n_{e}v_{e}Se=I_{0}exp[\frac{e(U_{p}-U_{s})}{kT_{e}}]</math> | |||
where <math>I_{0}=\frac{1}{4}n_{0}v_{e}Se=\frac{1}{4}n_{e}v_{e}Se</math> <br> | |||
We could take the logarithm form of the current as: | |||
<math display="block">\ln{I}=\ln{I}_{0}-\frac{eU_{s}}{kT_{e}}+\frac{eU_{p}}{kT_{e}}=\frac{eU_{p}}{kT_{e}}+const</math> | |||
From the equation, we get the linear relationship between the logarithmic current and the voltage. The slope <math>\tan{\Phi}</math> could be easily get from the I-V curve, which could then be used to decide the plasma parameters: | |||
<math display="block">\tan{\Phi}=\frac{\ln{I}}{U_{p}}=\frac{e}{kT_{e}}</math> | |||
<math display="block">T_{e}=\frac{e}{k\tan{\Phi}}</math> | |||
The average velocity of the electron is, | |||
<math display="block">v_{e}=\sqrt{\frac{8kT_{e}}{\pi m_{e}}}</math> | |||
Finally, the electron density could be shown as, | |||
<math display="block">n_{e}=\frac{4I_{0}}{eSv_{e}}=\frac{I_{0}}{eS}\sqrt{\frac{2\pi m_{e}}{kT_{e}}}</math> | |||
where S is the area of the probe exposed in the plasma.<br> | |||
As we see in the deduction, the plasma parameters could be calculated by simply looking into the slope of the I-V curve, which is very straightforward and convenient. Although we do not have much time to consider such a probe and method in our projects, it is still significant for us to show the method as an extension for our project here. | |||
===Paschen's Law=== | ===Paschen's Law=== | ||
| Line 49: | Line 134: | ||
At the same time however, the collision cross-section also decreases, reducing the occurrence of ionising collisions. | At the same time however, the collision cross-section also decreases, reducing the occurrence of ionising collisions. | ||
At a very low <math>pd</math>, the latter effect dominates, and thus a high voltage is needed for the multiplication to begin. | At a very low <math>pd</math>, the latter effect dominates, and thus a high voltage is needed for the multiplication to begin. | ||
We were unable to consistently ignite the glow discharge with the high-voltage power supply we had. Initially, this was solved by connecting a laser driver in parallel for ignition as shown. | |||
[[File:Argon-lamp-laser-schematics-laser-driver.png|360px|Added laser driver]] | |||
However, this did not allow us to conveniently measure the voltage across the lamp. | |||
We have instead achieved a more consistent ignition without the laser driver, but by momentarily shorting the electrodes with a short piece of wire. | |||
The results of the measurements are shown below, with a best-fit line of Paschen's law. | |||
[[File:Argon-lamp-laser-paschen-original.png|360px|Paschen's law fit original]] | |||
The fit is noticeably bad, with a large deviation for the value of <math>B</math> from what we expect. (For Ar, <math>A \approx 11.5</math> and <math>B \approx 176</math>. <ref>Lieberman, M. A., & Lichtenberg, A. J. (2005) Principles of plasma discharges and materials processing. Hoboken, N.J: Wiley-Interscience. 2nd Edition</ref>) | |||
It seems however reasonable to assume that our method of ignition introduces some current through the ballast resistor, causing a non-zero voltage drop across it. | |||
With this assumption, we propose a slight modification to the original model: | |||
<math> | |||
V_{\text{B}} - V_0 = \frac{Bpd}{\ln{(Apd)} - \ln{\Big[\ln{\Big(1 + \frac{1}{\gamma_{\text{se}}}\Big)}\Big]}} | |||
</math> | |||
where a constant voltage translation is introduced to account for the voltage across the ballast. | |||
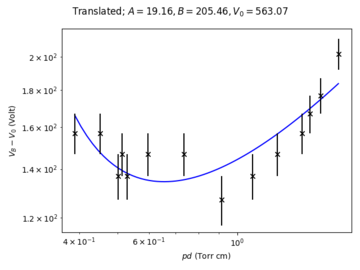
We were able to obtain a better fit as such, with closer values for the coefficients to the expected values. | |||
[[File:Argon-lamp-laser-paschen-translated.png|360px|Paschen's law fit translated]] | |||
===Hysteresis=== | ===Hysteresis=== | ||
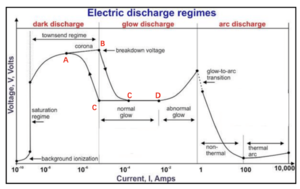
The breakdown voltage which ignites the plasma is different from the value by which the plasma glow goes off due to hysteresis. | |||
[[File:I-V_characteristics.png|thumb|Hysteresis I-V curve]] | |||
When increasing the voltage, a special phenomena will occur which is indicated by process A to B in the above figure. [https://en.wikipedia.org/wiki/Corona_discharge Corona discharges] occur in Townsend regime at high electric field near sharp edges, which is prior to electrical breakdown. Corona discharge is caused by the ionization of Argon at the high electric field region. If the coronal currents are high enough, corona discharges can be technically seen as “glow discharges”,which is also visible to human eyes. | |||
Nevertheless, when decreasing the voltage, the voltage maintains unchanged at significantly lower currents than at point C and only then makes the transition back to Townsend regime. | |||
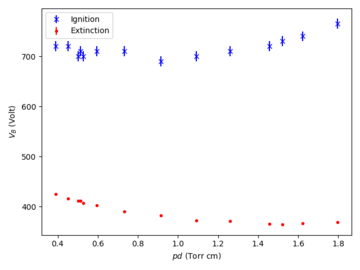
In our experiment, we observed that the breakdown voltage (voltage at ignition) is higher across all measured pressures than the extinction voltage. | |||
[[File:Argon-lamp-hysteresis.png|360px|Hysteresis original]] | |||
The occurrences of this hysteresis as well as sudden jumps of the discharge current, when changing the discharge parameters for instance: applied voltage, neutral gas pressure and electrode configuration, are both related to the circuit-related instability due to the onset of a negative differential resistance in the I-V curve of plasma discharge. | |||
The hysteresis is mainly connected with the power loss. As the applied voltage increases, more ionization occurs, and the charge density also increases. As a result, the current increases. However, the electron-ion recombination also occurs, which cause the loss of charge density. Thus, when the applied voltage decreases (the reverse), the discharge current is less than increasing the applied voltage. | |||
The hysteresis loop is related to the load resistance and gas pressure. The area of the hysteresis loop formed by the I-V curves is larger for the small resistor and smaller for the larger resistor. Besides, the area of the hysteresis loop decreases as the pressure declines. In addition, electrode separation distance does not influence the area of the hysteresis loop. | |||
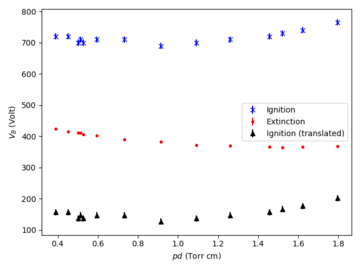
It is notable that, the measured extinction voltage, if we take it at its face value, poses a challenge to the earlier proposed modification to Paschen's law that provides us with a better fit for the data. | |||
[[File:Argon-lamp-hysteresis-added.png|360px|Hysteresis adjusted]] | |||
From the plot above, we find that the adjusted breakdown voltages is in fact lower than the extinction voltage, which contradicts the expected effects of the hysteresis. | |||
At the present time, we are unable to arrive at a resolution, and further measurements will be helpful. | |||
==Summary== | ==Summary== | ||
We have constructed a custom Argon-based gas discharge lamp with adjustable pressure and voltage. | |||
Optical characteristics of the plasma with varying pressures was visually observed. | |||
Within the glow discharge region, the I-V characteristics were studied at various pressures (around the ~mA range). | |||
The breakdown voltages of the lamp at various pressures were measured and compared with Paschen's law. | |||
Under a hypothesis that there is a non-zero current induced in this measurement, we have improved the fit by making an appropriate modification to the model --- where we translate a voltage to account for the voltage drop across the ballast resistor. | |||
Though this appears reasonable, it is later challenged by studying the extinction voltages. | |||
Finally, we observed a hysteresis effect, where the glow discharge was observed to be sustained at voltages below the breakdown voltage. | |||
This observation challenges the validity of the modification made to Paschen's law, since under the suggested modification the breakdown voltage would be lower than the extinction voltage. | |||
It is of great interest to investigate each part of the experiment in the future: | |||
* Quantifying the changes in the spectroscopic properties of the plasma under different pressures will be instructive in identifying the relevant transitions and their probabilities. | |||
* An ammeter with a wider bandwidth as well as a more powerful voltage supply will enable a more thorough characterisation of the I-V curve within and beyond the glow discharge regime. | |||
* A variable resistor and/or a smaller electrode distance can be used to investigate the validity of the model for the breakdown voltages. | |||
Furthermore, additional experiments may be performed to fully study the plasma. A movable Langmuir probe can be used to study spatial variations in the temperature, electron density and electric potential of the plasma, while an RF coil with a VNA can be used to measure the plasma frequency. | |||
==Sources== | |||
Paschen's law: | |||
<pre> | |||
import numpy as np | |||
from scipy.optimize import curve_fit | |||
import matplotlib.pyplot as plt | |||
D = 3.614 # in cm | |||
G = 0.01 # gamma | |||
with open('plasma2.txt', 'r') as f: | |||
content = f.readlines() | |||
data = np.array([c[:-1].split(',') for c in content[1:] if c != '\n'], dtype=float) | |||
def paschen(pd, A, B): | |||
return (B * pd) / (np.log(A * pd) - np.log(np.log(1 + (1 / G)))) | |||
def paschen_mod(pd, A, B, V0): | |||
return (B * pd) / (np.log(A * pd) - np.log(np.log(1 + (1 / G)))) + V0 | |||
def fit(x, y, func, p0): | |||
xx, yy = [], [] | |||
for i, yi in enumerate(y): | |||
if not np.isnan(yi): | |||
xx.append(x[i]) | |||
yy.append(yi) | |||
xx = np.array(xx) | |||
yy = np.array(yy) | |||
popt, _ = curve_fit(func, xx, yy, p0=p0) | |||
xfit = np.linspace(min(xx), max(xx), 101) | |||
return popt, xfit, func(xfit, *popt) | |||
pd = data[:, 0] * D | |||
v_f = data[:, 1] | |||
v_s = data[:, 2] | |||
i_s = data[:, 3] | |||
v_b = data[:, 4] | |||
poptf, pdffit, vaffit = fit(pd, v_f, paschen, p0=[12, 300]) | |||
print(f"original poptf: {poptf}") | |||
fig, ax = plt.subplots() | |||
fig.suptitle(r'Original; $A={:.2f}, B={:.2f}$'.format(*poptf)) | |||
ax.loglog(pd, v_f, 'kx') | |||
ax.loglog(pdffit, vaffit, 'b-') | |||
ax.errorbar(pd, v_f, 10, fmt='kx') | |||
ax.set_ylim(min(vaffit) - 20, max(vaffit) + 35) | |||
ax.set_xlabel(r'$pd$ (Torr cm)') | |||
ax.set_ylabel(r'$V_B$ (Volt)') | |||
plt.tight_layout() | |||
plt.savefig('Argon-lamp-paschen-original.png') | |||
plt.close('all') | |||
poptf, pdffit, vaffit = fit(pd, v_f, paschen_mod, p0=[12, 300, 500]) | |||
print(f"translated poptf: {poptf}") | |||
fig, ax = plt.subplots() | |||
fig.suptitle(r'Translated; $A={:.2f}, B={:.2f}, V_0={:.2f}$'.format(*poptf)) | |||
ax.loglog(pd, v_f - poptf[-1], 'kx') | |||
ax.loglog(pdffit, vaffit - poptf[-1], 'b-') | |||
ax.errorbar(pd, v_f - poptf[-1], 10, fmt='kx') | |||
ax.set_ylim(min(vaffit) - poptf[-1] - 20, max(vaffit) - poptf[-1] + 35) | |||
ax.set_xlabel(r'$pd$ (Torr cm)') | |||
ax.set_ylabel(r'$V_B - V_0$ (Volt)') | |||
plt.tight_layout() | |||
plt.savefig('Argon-lamp-paschen-translated.png') | |||
</pre> | |||
Hysteresis: | |||
<pre> | |||
import numpy as np | |||
import matplotlib.pyplot as plt | |||
D = 3.614 # in cm | |||
G = 0.01 # gamma | |||
with open('plasma2.txt', 'r') as f: | |||
content = f.readlines() | |||
data = np.array([c[:-1].split(',') for c in content[1:] if c != '\n'], dtype=float) | |||
pd = data[:, 0] * D | |||
v_f = data[:, 1] | |||
v_s = data[:, 2] | |||
i_s = data[:, 3] | |||
v_b = data[:, 4] | |||
pdd, vff, vbb = [], [], [] | |||
for i in range(len(v_f)): | |||
if not np.isnan(v_f[i]) and not np.isnan(v_b[i]): | |||
pdd.append(pd[i]) | |||
vff.append(v_f[i]) | |||
vbb.append(v_b[i]) | |||
V0 = 563.07 | |||
fig, ax = plt.subplots() | |||
# ax.plot(pdd, vff, 'bx') | |||
# ax.plot(pdd, vbb, 'r.') | |||
ax.errorbar(pdd, vff, 10, fmt='bx', label='Ignition') | |||
ax.errorbar(pdd, vbb, 1, fmt='r.', label='Extinction') | |||
ax.set_xlabel(r'$pd$ (Torr cm)') | |||
ax.set_ylabel(r'$V_B$ (Volt)') | |||
plt.legend() | |||
plt.tight_layout() | |||
plt.savefig('Argon-lamp-hysteresis.png') | |||
ax.errorbar(pdd, [v - V0 for v in vff], 10, fmt='k^', label='Ignition (translated)') | |||
plt.legend() | |||
plt.tight_layout() | |||
plt.savefig('Argon-lamp-hysteresis-added.png') | |||
</pre> | |||
==References== | ==References== | ||
Latest revision as of 16:15, 30 April 2022
By applying a sufficiently high DC voltage across a gas, the gas atoms/molecules are ionised by the strong electric field. In this project, we construct an Argon-based gas discharge lamp, with adjustable pressure and voltage. The breakdown voltage of Argon gas with respect to pressure changes is observed, and compared with Paschen's law. We also observe changes in the spectroscopic properties of the plasma with varying pressure.
Setup
A small air-tight chamber was evacuated with a rotary vane pump to about Torr (measured with a Pirani gauge). Then, Argon gas was slowly introduced to the chamber via a needle valve, until the chamber reached the pressure of about to Torr. The metallic cylinder that interfaces with the gas lines forms the cathode of the chamber, and is grounded. Another metallic cylinder (anode) was attached to the cathode using a glass pipe.
The glass pipe provides an electrical isolation between the cathode and the anode, and provides a viewport for the experimenter to observe glow discharge. The anode was connected to the positive terminal of a high-voltage power supply, which can reach upto 760 V. Epoxy was used to connect the pieces and seal the vacuum chamber. A ballast resistor (33 kΩ) was added in series with the gas discharge lamp in order to limit the current. The electrodes were mechanically held using laser-cut acrylic plates fixed to an optical breadboard using brackets and bolts. Multimeters were used to monitor the current and the voltage across the lamp.
Additional details:
- Electrodes: The electrodes were made by boring a hole through the centre of a cylindrical piece of aluminium(?) using a lathe. By facing the surfaces and cutting out the corners at 45 degrees angle, sharp edges were minimised to reduce charge leakage through corona discharge.
- Glass pipe: The glass pipe was cut from a longer piece of quartz glass pipe.
- Vacuum fittings: The cathode is connected to a metal pipe attached to a KF blank flange with a hole. The rest of the vacuum fittings are connected via rubber o-rings and clamps.
- High-voltage probe: The high-voltage of the anode was measured with a voltage divider (1:1000) probe, connected to a multimeter.
Measurements
The chief advantage of our setup is the capability to adjust the pressure of the Argon gas. As such, our measurements focus on breakdown voltages, extinction voltages, and I-V characterestics of the glow discharge, at various pressures.
Important parameters about plasma
- Debye Length
When applying an electric field in the plasma, the charged particles will react to reduce the effect of the field. Whenever the plasma had an extra number of positive or negative particles, this part of particles would create an electric field and the electrons will move to cancel the charge. The response of this reduction effect of the electric fields is Debye shielding, which gives the plasma its quasi-neutrality characteristic. Based on this, the concentration of charged particles near two electrodes will shield the charged surfaces from the bulk. The applied electrical potential will develop mostly near the plates over some distance, which is called Debye Length.
- Plasma Frequency
When the electrons move under force of electric field from the charge balance, they respond to the fields and accelerate. As a result, the oscillatory motion is executed. These oscillations have the so called plasma frequency, and it could be expressed as:
- Mean Free Path
When the atoms are moving, they could collide with other atoms. Between the collisions, we suppose that the atoms travel in a straight line. Since the atoms are randomly distributed, each one moves with different velocities and their travel distances between two collisions could be averaged as the mean free path, which could be expressed as:
Glow Discharge
The figure is from glow discharge.A-D region, F-H region and I-K region separately represent the dark discharge, glow discharge and arc discharge region.
- In a dark discharge, the carriers are generated during the inonization process by a radiation sorce. The voltage is applied across the anode and cathode.At higher voltage, the freed carriers could obtain enough energy so that additional carriers are freed during collisions.
- In glow discharge, the carrier generation process reaches a point where the average electron leaving the cathode allows another electron to leave the cathode.
- In an arc discharge, electrons leave the cathode by thermionic emission and field emission, and the gas is ionized by thermal means.

We also attach a diagram here to illustrate the distributions of some physics quantities regarding the plasma. [1])In our project, we mainly studied the property and characteristics within the glow discharge region, given the limitation of the supplies and pump we had. The figure shows the names of different glowing regions in the Argon as well as the graphs showing the variation of the potential(), electric field(), current density() along the tube. In our case, the distance between the cathode and anode () is 3.164cm.
Generally, the plasma at the region of glow discharge has the following properties:
- The plasma is highly ionized and has good electrical and thermal conductivity. It has a specific heat capacity hundreds of times larger than ordinary gases.
- Positively and negatively charged particles have almost equal densities.
- Macroscopically it is neutral.
- It has glow feature, the average kinetic energy of the electron is much higher than that of the other particles, so it's not in equilibrium.
We qualitatively observe the changes in the spectroscopic properties in the stable DC Argon plasma, as we vary the pressure. The colours of the glow shifts from pink, to purple, to pale blue, as the pressure increases from approxmiately 0.03 Torr to 3 Torr.
| Pressure (Torr) | Video Frame |
|---|---|
| 0.03 | 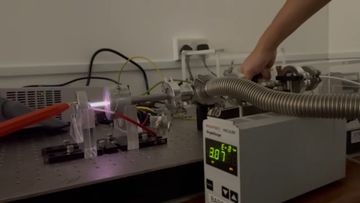
|
| 0.3 | 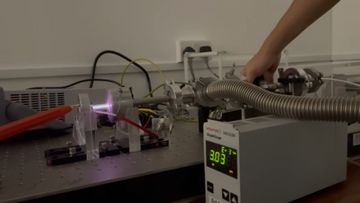
|
| 3 | 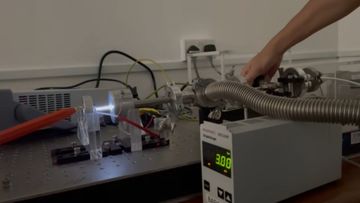
|
File:Argon-lamp-glow-compressed.mp4 (download to view)
In the glow discharge, the pressure appiled could be related with the mean free path of the Argon atoms. Higher pressure means the shorter mean free path. Consider the situation of the constant voltage, so that the constant elecrical field between the cathode and anode in our project, shorter mean free path allows a charged particle to gain less energy before colliding with another article. So that as the pressure goes up, we get a bluer light which means the less energy.
Here the voltage is all larger than the breakdown voltage in the backward direction. Because of the existance of the hysteresis effect, the breakdown voltage which igniting the plasma is different from the value by which the glow plasma extincts. This is discussed below in the hysteresis part. We obtain this curve by first igniting the plasma with the application of the laser high-voltage supply and set the voltage supply to its upper limit. Then we change the voltage at the supply and measure the I-V data points of between the anode and cathode till the plasma extincts. And we repeat the measurement under different pressures.
Although the ranges of current and voltage are both limited here, we still get a I-V curve whose trend correspond with the normal glow distribution part quite well.
Regarding the relationship between the pressure and the value of the breakdown voltage, which is close to the lower limit of each I-V curve here, from the figure, what we can learn is that generally, the higher pressure the plasma is under, the lower the breakdown voltage will be.However, because of the limited number of data points we have, we cannot get an accurate prediction of the related parameters here. Next, we would introduce a method which could efficiently measure the parameters about the plasma.
Langmuir probe
Langmuir probe is a devices used to determine the electron temperature, electron density and electric potential of a plasma. It works by inserting one or more electrodes into a plasma. We get the I-V characteristic curve by measuring the current through it and voltage between it and the anode.
For the region 3 of the I-V curve, since the electrons are subjected to a decelerating potential , only the electrons with higher energy than can reach the probe. If we assume that the velocities of electrons in plasma obey Maxwell-Boltzmann distribution, then the electron density near the probe could be described as,
If the average velocity of electron is , then the number of electrons position at the probe of the area will be:
We could take the logarithm form of the current as:
As we see in the deduction, the plasma parameters could be calculated by simply looking into the slope of the I-V curve, which is very straightforward and convenient. Although we do not have much time to consider such a probe and method in our projects, it is still significant for us to show the method as an extension for our project here.
Paschen's Law
The ions and free electrons produced from a sufficiently high voltage (above breakdown voltage) move towards the respective electrodes, and current is formed across the lamp. The moving charges collide with other particles to multiply the number of charge carriers in the gas. This process is known as Townsend avalanche or multiplication. The excited atoms and ions decay to the ground state and emit light, in the form of glow discharge.
The change in the breakdown voltage with respect to the pressure of the gas can be described by Paschen's Law, according to which the breakdown voltage given by
where is the pressure, is the distance between the electrodes (here, is constant), is the secondary-electron-emission coefficient, and and are empirically determined constants. represents the saturation ionisation, and is related to the excitation and ionisation energies.
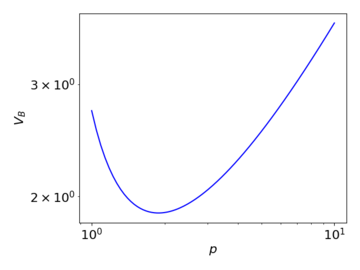
The above graph illustrates qualitatively how the breakdown voltage varies with pressure, under Paschen's law. When the pressure decreases, the mean free path of the moving charges increases, enabling them to accumulate sufficient energy for the multiplication process with a lower required applied voltage. At the same time however, the collision cross-section also decreases, reducing the occurrence of ionising collisions. At a very low , the latter effect dominates, and thus a high voltage is needed for the multiplication to begin.
We were unable to consistently ignite the glow discharge with the high-voltage power supply we had. Initially, this was solved by connecting a laser driver in parallel for ignition as shown.
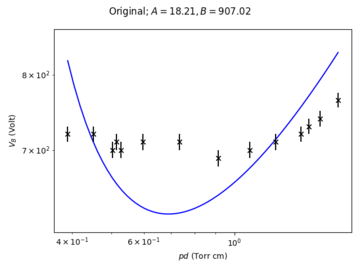
However, this did not allow us to conveniently measure the voltage across the lamp. We have instead achieved a more consistent ignition without the laser driver, but by momentarily shorting the electrodes with a short piece of wire. The results of the measurements are shown below, with a best-fit line of Paschen's law.
The fit is noticeably bad, with a large deviation for the value of from what we expect. (For Ar, and . [2]) It seems however reasonable to assume that our method of ignition introduces some current through the ballast resistor, causing a non-zero voltage drop across it. With this assumption, we propose a slight modification to the original model:
where a constant voltage translation is introduced to account for the voltage across the ballast. We were able to obtain a better fit as such, with closer values for the coefficients to the expected values.
Hysteresis
The breakdown voltage which ignites the plasma is different from the value by which the plasma glow goes off due to hysteresis.
When increasing the voltage, a special phenomena will occur which is indicated by process A to B in the above figure. Corona discharges occur in Townsend regime at high electric field near sharp edges, which is prior to electrical breakdown. Corona discharge is caused by the ionization of Argon at the high electric field region. If the coronal currents are high enough, corona discharges can be technically seen as “glow discharges”,which is also visible to human eyes. Nevertheless, when decreasing the voltage, the voltage maintains unchanged at significantly lower currents than at point C and only then makes the transition back to Townsend regime.
In our experiment, we observed that the breakdown voltage (voltage at ignition) is higher across all measured pressures than the extinction voltage.
The occurrences of this hysteresis as well as sudden jumps of the discharge current, when changing the discharge parameters for instance: applied voltage, neutral gas pressure and electrode configuration, are both related to the circuit-related instability due to the onset of a negative differential resistance in the I-V curve of plasma discharge.
The hysteresis is mainly connected with the power loss. As the applied voltage increases, more ionization occurs, and the charge density also increases. As a result, the current increases. However, the electron-ion recombination also occurs, which cause the loss of charge density. Thus, when the applied voltage decreases (the reverse), the discharge current is less than increasing the applied voltage.
The hysteresis loop is related to the load resistance and gas pressure. The area of the hysteresis loop formed by the I-V curves is larger for the small resistor and smaller for the larger resistor. Besides, the area of the hysteresis loop decreases as the pressure declines. In addition, electrode separation distance does not influence the area of the hysteresis loop.
It is notable that, the measured extinction voltage, if we take it at its face value, poses a challenge to the earlier proposed modification to Paschen's law that provides us with a better fit for the data.
From the plot above, we find that the adjusted breakdown voltages is in fact lower than the extinction voltage, which contradicts the expected effects of the hysteresis. At the present time, we are unable to arrive at a resolution, and further measurements will be helpful.
Summary
We have constructed a custom Argon-based gas discharge lamp with adjustable pressure and voltage. Optical characteristics of the plasma with varying pressures was visually observed. Within the glow discharge region, the I-V characteristics were studied at various pressures (around the ~mA range). The breakdown voltages of the lamp at various pressures were measured and compared with Paschen's law. Under a hypothesis that there is a non-zero current induced in this measurement, we have improved the fit by making an appropriate modification to the model --- where we translate a voltage to account for the voltage drop across the ballast resistor. Though this appears reasonable, it is later challenged by studying the extinction voltages. Finally, we observed a hysteresis effect, where the glow discharge was observed to be sustained at voltages below the breakdown voltage. This observation challenges the validity of the modification made to Paschen's law, since under the suggested modification the breakdown voltage would be lower than the extinction voltage.
It is of great interest to investigate each part of the experiment in the future:
- Quantifying the changes in the spectroscopic properties of the plasma under different pressures will be instructive in identifying the relevant transitions and their probabilities.
- An ammeter with a wider bandwidth as well as a more powerful voltage supply will enable a more thorough characterisation of the I-V curve within and beyond the glow discharge regime.
- A variable resistor and/or a smaller electrode distance can be used to investigate the validity of the model for the breakdown voltages.
Furthermore, additional experiments may be performed to fully study the plasma. A movable Langmuir probe can be used to study spatial variations in the temperature, electron density and electric potential of the plasma, while an RF coil with a VNA can be used to measure the plasma frequency.
Sources
Paschen's law:
import numpy as np
from scipy.optimize import curve_fit
import matplotlib.pyplot as plt

D = 3.614  # in cm
G = 0.01   # gamma

with open('plasma2.txt', 'r') as f:
    content = f.readlines()
data = np.array([c[:-1].split(',') for c in content[1:] if c != '\n'], dtype=float)

def paschen(pd, A, B):
    return (B * pd) / (np.log(A * pd) - np.log(np.log(1 + (1 / G))))

def paschen_mod(pd, A, B, V0):
    return (B * pd) / (np.log(A * pd) - np.log(np.log(1 + (1 / G)))) + V0

def fit(x, y, func, p0):
    xx, yy = [], []
    for i, yi in enumerate(y):
        if not np.isnan(yi):
            xx.append(x[i])
            yy.append(yi)
    xx = np.array(xx)
    yy = np.array(yy)
    popt, _ = curve_fit(func, xx, yy, p0=p0)
    xfit = np.linspace(min(xx), max(xx), 101)
    return popt, xfit, func(xfit, *popt)

pd = data[:, 0] * D
v_f = data[:, 1]
v_s = data[:, 2]
i_s = data[:, 3]
v_b = data[:, 4]

poptf, pdffit, vaffit = fit(pd, v_f, paschen, p0=[12, 300])
print(f"original poptf: {poptf}")

fig, ax = plt.subplots()
fig.suptitle(r'Original; $A={:.2f}, B={:.2f}$'.format(*poptf))
ax.loglog(pd, v_f, 'kx')
ax.loglog(pdffit, vaffit, 'b-')
ax.errorbar(pd, v_f, 10, fmt='kx')
ax.set_ylim(min(vaffit) - 20, max(vaffit) + 35)
ax.set_xlabel(r'$pd$ (Torr cm)')
ax.set_ylabel(r'$V_B$ (Volt)')
plt.tight_layout()
plt.savefig('Argon-lamp-paschen-original.png')
plt.close('all')

poptf, pdffit, vaffit = fit(pd, v_f, paschen_mod, p0=[12, 300, 500])
print(f"translated poptf: {poptf}")

fig, ax = plt.subplots()
fig.suptitle(r'Translated; $A={:.2f}, B={:.2f}, V_0={:.2f}$'.format(*poptf))
ax.loglog(pd, v_f - poptf[-1], 'kx')
ax.loglog(pdffit, vaffit - poptf[-1], 'b-')
ax.errorbar(pd, v_f - poptf[-1], 10, fmt='kx')
ax.set_ylim(min(vaffit) - poptf[-1] - 20, max(vaffit) - poptf[-1] + 35)
ax.set_xlabel(r'$pd$ (Torr cm)')
ax.set_ylabel(r'$V_B - V_0$ (Volt)')
plt.tight_layout()
plt.savefig('Argon-lamp-paschen-translated.png')
Hysteresis:
import numpy as np
import matplotlib.pyplot as plt

D = 3.614  # in cm
G = 0.01   # gamma

with open('plasma2.txt', 'r') as f:
    content = f.readlines()
data = np.array([c[:-1].split(',') for c in content[1:] if c != '\n'], dtype=float)

pd = data[:, 0] * D
v_f = data[:, 1]
v_s = data[:, 2]
i_s = data[:, 3]
v_b = data[:, 4]

pdd, vff, vbb = [], [], []
for i in range(len(v_f)):
    if not np.isnan(v_f[i]) and not np.isnan(v_b[i]):
        pdd.append(pd[i])
        vff.append(v_f[i])
        vbb.append(v_b[i])

V0 = 563.07

fig, ax = plt.subplots()
# ax.plot(pdd, vff, 'bx')
# ax.plot(pdd, vbb, 'r.')
ax.errorbar(pdd, vff, 10, fmt='bx', label='Ignition')
ax.errorbar(pdd, vbb, 1, fmt='r.', label='Extinction')
ax.set_xlabel(r'$pd$ (Torr cm)')
ax.set_ylabel(r'$V_B$ (Volt)')
plt.legend()
plt.tight_layout()
plt.savefig('Argon-lamp-hysteresis.png')

ax.errorbar(pdd, [v - V0 for v in vff], 10, fmt='k^', label='Ignition (translated)')
plt.legend()
plt.tight_layout()
plt.savefig('Argon-lamp-hysteresis-added.png')






![{\displaystyle n_{e}=n_{0}exp[{\frac {e(U_{p}-U_{s})}{kT_{e}}}]}](https://wikimedia.org/api/rest_v1/media/math/render/svg/2647a4a1ac6be38458cd392f509f4aeebca199e5)


![{\displaystyle I=N_{e}e={\frac {1}{4}}n_{e}v_{e}Se=I_{0}exp[{\frac {e(U_{p}-U_{s})}{kT_{e}}}]}](https://wikimedia.org/api/rest_v1/media/math/render/svg/f4f6a3e99e1965423e22a59482f86d8b5320bc76)


![{\displaystyle V_{\text{B}}={\frac {Bpd}{\ln {(Apd)}-\ln {{\Big [}\ln {{\Big (}1+{\frac {1}{\gamma _{\text{se}}}}{\Big )}}{\Big ]}}}}}](https://wikimedia.org/api/rest_v1/media/math/render/svg/79dee18587a3612059320f91a1db62f712212d1d)






![{\displaystyle V_{\text{B}}-V_{0}={\frac {Bpd}{\ln {(Apd)}-\ln {{\Big [}\ln {{\Big (}1+{\frac {1}{\gamma _{\text{se}}}}{\Big )}}{\Big ]}}}}}](https://wikimedia.org/api/rest_v1/media/math/render/svg/78f0e2d0152a612e687aaa5b58cfdb1ac1701b42)
