Argon gas discharge lamp: Difference between revisions
| Line 31: | Line 31: | ||
| <chem>Ar + e^{-} ->Ar + e^{-} </chem> || elastic collision | | <chem>Ar + e^{-} ->Ar + e^{-} </chem> || elastic collision | ||
|- | |- | ||
| <chem>Ar + e^{-} ->Ar^ | | <chem>Ar + e^{-} ->Ar^+ + 2e^- </chem> ||ionization | ||
|- | |- | ||
| <chem>Ar + e^{-} ->Ar_m^{*} + e^{-} </chem>||excitation | | <chem>Ar + e^{-} ->Ar_m^{*} + e^{-} </chem>||excitation | ||
Revision as of 08:55, 29 April 2022
By applying a sufficiently high DC voltage across a gas, the gas atoms/molecules are ionised by the strong electric field. In this project, we construct an Argon-based gas discharge lamp, with adjustable pressure and voltage. The breakdown voltage of Argon gas with respect to pressure changes is observed, and compared with Paschen's law. We also observe changes in the spectroscopic properties of the plasma with varying pressure.
Setup
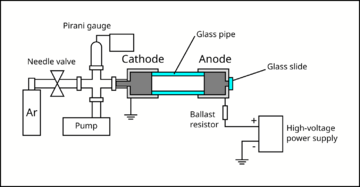
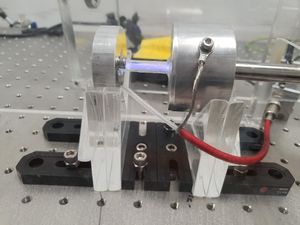
A small air-tight chamber was evacuated with a rotary vane pump to about Failed to parse (SVG (MathML can be enabled via browser plugin): Invalid response ("Math extension cannot connect to Restbase.") from server "https://wikimedia.org/api/rest_v1/":): {\displaystyle 3\times10^{-3}} Torr (measured with a Pirani gauge). Then, Argon gas was slowly introduced to the chamber via a needle valve, until the chamber reached the pressure of about Failed to parse (SVG (MathML can be enabled via browser plugin): Invalid response ("Math extension cannot connect to Restbase.") from server "https://wikimedia.org/api/rest_v1/":): {\displaystyle 10^{-1}} to Torr. The metallic cylinder that interfaces with the gas lines forms the cathode of the chamber, and is grounded. Another metallic cylinder (anode) was attached to the cathode using a glass pipe.
The glass pipe provides an electrical isolation between the cathode and the anode, and provides a viewport for the experimenter to observe glow discharge. The anode was connected to the positive terminal of a high-voltage power supply, which can reach upto 760 V. Epoxy was used to connect the pieces and seal the vacuum chamber. A ballast resistor (33 kΩ) was added in series with the gas discharge lamp in order to limit the current. The electrodes were mechanically held using laser-cut acrylic plates fixed to an optical breadboard using brackets and bolts. Multimeters were used to monitor the current and the voltage across the lamp.
Additional details:
- Electrodes: The electrodes were made by boring a hole through the centre of a cylindrical piece of aluminium(?) using a lathe. By facing the surfaces and cutting out the corners at 45 degrees angle, sharp edges were minimised to reduce charge leakage through corona discharge.
- Glass pipe: The glass pipe was cut from a longer piece of quartz glass pipe.
- Vacuum fittings: The cathode is connected to a metal pipe attached to a KF blank flange with a hole. The rest of the vacuum fittings are connected via rubber o-rings and clamps.
- High-voltage probe: The high-voltage of the anode was measured with a voltage divider (1:1000) probe, connected to a multimeter.
Measurements
The chief advantage of our setup is the capability to adjust the pressure of the Argon gas.
Kinetic scheme of processes inside Argon
The possible processes that atoms may undergo are shown in the following table.
| Process | Name of process |
|---|---|
| Failed to parse (SVG (MathML can be enabled via browser plugin): Invalid response ("Math extension cannot connect to Restbase.") from server "https://wikimedia.org/api/rest_v1/":): {\displaystyle \ce{Ar + e^{-} ->Ar + e^{-} }} | elastic collision |
| Failed to parse (SVG (MathML can be enabled via browser plugin): Invalid response ("Math extension cannot connect to Restbase.") from server "https://wikimedia.org/api/rest_v1/":): {\displaystyle \ce{Ar + e^{-} ->Ar^+ + 2e^- }} | ionization |
| Failed to parse (SVG (MathML can be enabled via browser plugin): Invalid response ("Math extension cannot connect to Restbase.") from server "https://wikimedia.org/api/rest_v1/":): {\displaystyle \ce{Ar + e^{-} ->Ar_m^{*} + e^{-} }} | excitation |
| Failed to parse (SVG (MathML can be enabled via browser plugin): Invalid response ("Math extension cannot connect to Restbase.") from server "https://wikimedia.org/api/rest_v1/":): {\displaystyle \ce{Arm^{*} + e^{-} ->Ar + e^{-} }} | de-excitation |
| Failed to parse (SVG (MathML can be enabled via browser plugin): Invalid response ("Math extension cannot connect to Restbase.") from server "https://wikimedia.org/api/rest_v1/":): {\displaystyle \ce{Ar_{m}^{*} + Ar_{m}^{*} ->Ar^{+} + e^{-} +Ar}} | chemo-ionization |
| Failed to parse (SVG (MathML can be enabled via browser plugin): Invalid response ("Math extension cannot connect to Restbase.") from server "https://wikimedia.org/api/rest_v1/":): {\displaystyle \ce{Ar_{m}^{*} ->Ar + h\nu }} | radiation |
Glow Discharge
We qualitatively observe the changes in the spectroscopic properties in the stable DC Argon plasma, as we vary the pressure. The colours of the glow shifts from pink, to purple, to pale blue, as the pressure increases from approxmiately 0.03 Torr to 3 Torr.
| Pressure (Torr) | Video Frame |
|---|---|
| 0.03 | 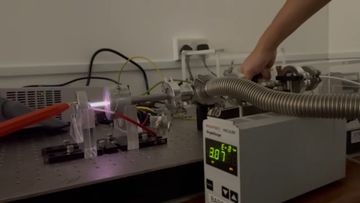
|
| 0.3 | 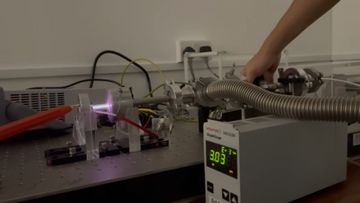
|
| 3 | 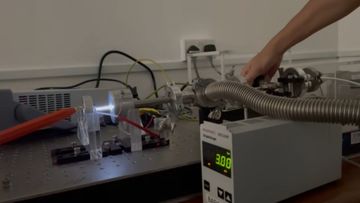
|
File:Argon-lamp-glow-compressed.mp4 (download to view)
In the glow discharge, the pressure appiled could be related with the mean free path of the Argon atoms. Higher pressure means the shorter mean free path. Consider the situation of the constant voltage, so that the constant elecrical field between the cathode and anode in our project, shorter mean free path allows a charged particle to gain less energy before colliding with another article. So that as the pressure goes up, we get a bluer light which means the less energy.
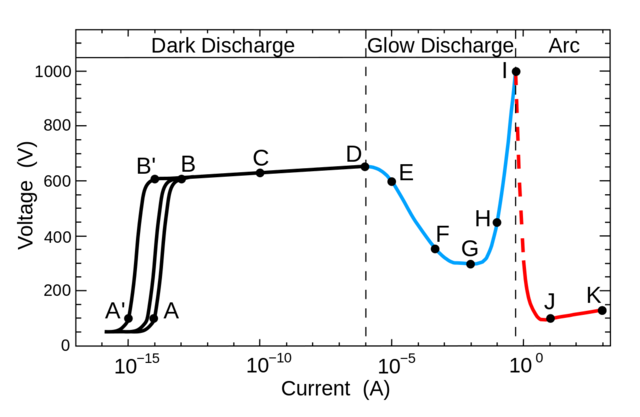
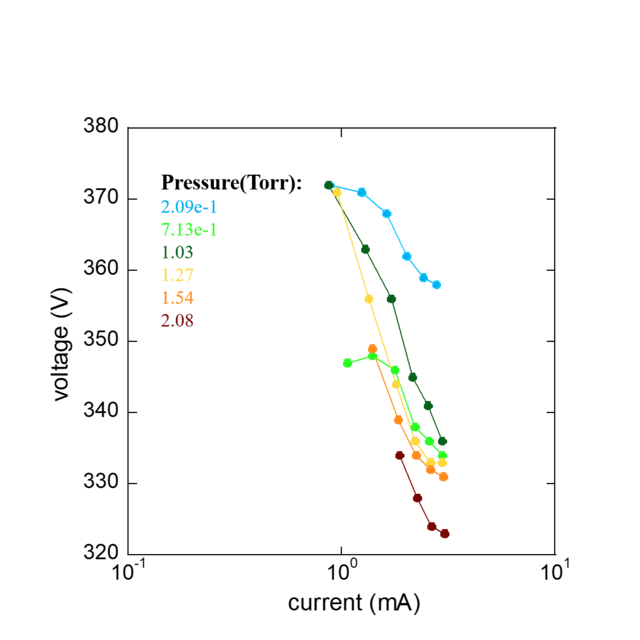
The figure is from glow discharge.A-D region, F-H region and I-K region separately represent the dark discharge, glow discharge and arc discharge region.
- In a dark discharge, the carriers are generated during the inonization process by a radiation sorce. The voltage is applied across the anode and cathode.At higher voltage, the freed carriers could obtain enough energy so that additional carriers are freed during collisions.
- In glow discharge, the carrier generation process reaches a point where the average electron leaving the cathode allows another electron to leave the cathode.
- In an arc discharge, electrons leave the cathode by thermionic emission and field emission, and the gas is ionized by thermal means.
Here, the current range we could obtain with the voltage supply is mainly whithin the glow discharge range, so discussion is mainly about the discharge range.
Paschen's Law
The ions and free electrons produced from a sufficiently high voltage (above breakdown voltage) move towards the respective electrodes, and current is formed across the lamp. The moving charges collide with other particles to multiply the number of charge carriers in the gas. This process is known as Townsend avalanche or multiplication. The excited atoms and ions decay to the ground state and emit light, in the form of glow discharge.
The change in the breakdown voltage with respect to the pressure of the gas can be described by Paschen's Law, according to which the breakdown voltage given by
Failed to parse (SVG (MathML can be enabled via browser plugin): Invalid response ("Math extension cannot connect to Restbase.") from server "https://wikimedia.org/api/rest_v1/":): {\displaystyle V_{\text{B}} = \frac{Bpd}{\ln{(Apd)} - \ln{\Big[\ln{\Big(1 + \frac{1}{\gamma_{\text{se}}}\Big)}\Big]}} }
where Failed to parse (SVG (MathML can be enabled via browser plugin): Invalid response ("Math extension cannot connect to Restbase.") from server "https://wikimedia.org/api/rest_v1/":): {\displaystyle p} is the pressure, Failed to parse (SVG (MathML can be enabled via browser plugin): Invalid response ("Math extension cannot connect to Restbase.") from server "https://wikimedia.org/api/rest_v1/":): {\displaystyle d} is the distance between the electrodes (here, Failed to parse (SVG (MathML can be enabled via browser plugin): Invalid response ("Math extension cannot connect to Restbase.") from server "https://wikimedia.org/api/rest_v1/":): {\displaystyle d} is constant), Failed to parse (SVG (MathML can be enabled via browser plugin): Invalid response ("Math extension cannot connect to Restbase.") from server "https://wikimedia.org/api/rest_v1/":): {\displaystyle \gamma_{\text{se}}} is the secondary-electron-emission coefficient, and Failed to parse (SVG (MathML can be enabled via browser plugin): Invalid response ("Math extension cannot connect to Restbase.") from server "https://wikimedia.org/api/rest_v1/":): {\displaystyle A} and Failed to parse (SVG (MathML can be enabled via browser plugin): Invalid response ("Math extension cannot connect to Restbase.") from server "https://wikimedia.org/api/rest_v1/":): {\displaystyle B} are empirically determined constants. Failed to parse (SVG (MathML can be enabled via browser plugin): Invalid response ("Math extension cannot connect to Restbase.") from server "https://wikimedia.org/api/rest_v1/":): {\displaystyle A} represents the saturation ionisation, and Failed to parse (SVG (MathML can be enabled via browser plugin): Invalid response ("Math extension cannot connect to Restbase.") from server "https://wikimedia.org/api/rest_v1/":): {\displaystyle B} is related to the excitation and ionisation energies.
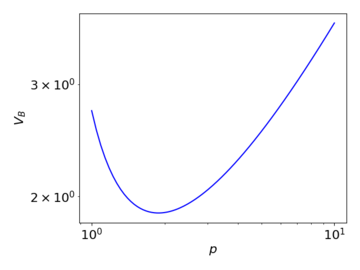
The above graph illustrates qualitatively how the breakdown voltage varies with pressure, under Paschen's law. When the pressure decreases, the mean free path of the moving charges increases, enabling them to accumulate sufficient energy for the multiplication process with a lower required applied voltage. At the same time however, the collision cross-section also decreases, reducing the occurrence of ionising collisions. At a very low Failed to parse (SVG (MathML can be enabled via browser plugin): Invalid response ("Math extension cannot connect to Restbase.") from server "https://wikimedia.org/api/rest_v1/":): {\displaystyle pd} , the latter effect dominates, and thus a high voltage is needed for the multiplication to begin.
We were unable to consistently ignite the glow discharge with the high-voltage power supply we had. Initially, this was solved by connecting a laser driver in parallel for ignition as shown.
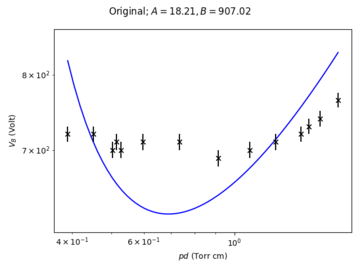
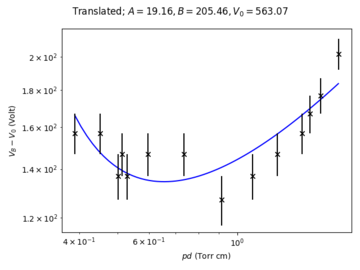
However, this did not allow us to conveniently measure the voltage across the lamp. We have instead achieved a more consistent ignition without the laser driver, but by momentarily shorting the electrodes with a short piece of wire. The results of the measurements are shown below, with a best-fit line of Paschen's law.
The fit is noticeably bad, with a large deviation for the value of Failed to parse (SVG (MathML can be enabled via browser plugin): Invalid response ("Math extension cannot connect to Restbase.") from server "https://wikimedia.org/api/rest_v1/":): {\displaystyle B} from what we expect. (For Ar, Failed to parse (SVG (MathML can be enabled via browser plugin): Invalid response ("Math extension cannot connect to Restbase.") from server "https://wikimedia.org/api/rest_v1/":): {\displaystyle A \approx 11.5} and Failed to parse (SVG (MathML can be enabled via browser plugin): Invalid response ("Math extension cannot connect to Restbase.") from server "https://wikimedia.org/api/rest_v1/":): {\displaystyle B \approx 176} . [1]) It seems however reasonable to assume that our method of ignition introduces some current through the ballast resistor, causing a non-zero voltage drop across it. With this assumption, we propose a slight modification to the original model:
Failed to parse (SVG (MathML can be enabled via browser plugin): Invalid response ("Math extension cannot connect to Restbase.") from server "https://wikimedia.org/api/rest_v1/":): {\displaystyle V_{\text{B}} - V_0 = \frac{Bpd}{\ln{(Apd)} - \ln{\Big[\ln{\Big(1 + \frac{1}{\gamma_{\text{se}}}\Big)}\Big]}} }
where a constant voltage translation is introduced to account for the voltage across the ballast. We were able to obtain a better fit as such, with closer values for the coefficients to the expected values.
Hysteresis
Stability?
Summary
References
Source Files
- ↑ Lieberman, M. A., & Lichtenberg, A. J. (2005) Principles of plasma discharges and materials processing. Hoboken, N.J: Wiley-Interscience. 2nd Edition

