Laser Microphone: Difference between revisions
Nicholas cjl (talk | contribs) No edit summary |
Nicholas cjl (talk | contribs) |
||
| Line 57: | Line 57: | ||
The gain curves for various orders of low-pass Butterworth filters are shown in the plot below, showing a roll-off of <math>-20n</math> dB/decade of frequency. The roll-off at the cutoff frequency also gets sharper (roll-off starts closer to the cutoff frequency <math>f_c</math> as opposed to slightly before <math>f_c</math>) as the order of the filter increases, as can be seen in the zoomed in plot below. | The gain curves for various orders of low-pass Butterworth filters are shown in the plot below, showing a roll-off of <math>-20n</math> dB/decade of frequency. The roll-off at the cutoff frequency also gets sharper (roll-off starts closer to the cutoff frequency <math>f_c</math> as opposed to slightly before <math>f_c</math>) as the order of the filter increases, as can be seen in the zoomed in plot below. | ||
<gallery widths=500px heights= | <gallery widths=500px heights=300px> | ||
File:NMLMbworth filter gain.png|Plot of the (power) gain <math>G(f)</math> of low-pass Butterworth filters of different orders with cutoff frequency <math>f=1</math>, showing the increasing rate of frequency rejection as the order of the filters increase. | File:NMLMbworth filter gain.png|Plot of the (power) gain <math>G(f)</math> of low-pass Butterworth filters of different orders with cutoff frequency <math>f=1</math>, showing the increasing rate of frequency rejection as the order of the filters increase. | ||
File:NMLMbworth filter gain zoomed.png|Plot of the different order low-pass Butterworth filters with the cutoff point magnified, showing increasing sharpness and precision in the cutoff behaviour as the order of the filters increase. | File:NMLMbworth filter gain zoomed.png|Plot of the different order low-pass Butterworth filters with the cutoff point magnified, showing increasing sharpness and precision in the cutoff behaviour as the order of the filters increase. | ||
Revision as of 07:36, 18 April 2022
A laser spot illuminating a vibrating surface should move along with it, and tracking the motion of the spot should theoretically allow us to retrieve some of the information regarding the vibrations of the surface. If a loud enough sound causes the surface to vibrate, this should theoretically be enough for the transmission of audio information through visual means. The signal obtained will then be put through a few different digital signal processing techniques in an attempt to retrieve a (good enough) copy of the original audio.
The possible applications for such a device are already covered by existing mature technologies, but the idea of transmitting raw sound information "directly" via a laser without physical connections or converting the information into a different representation based on a special protocol (e.g. Wi-Fi[1] or Bluetooth[2]) is in itself an interesting curiosity. In this project, we will attempt to explore the effectiveness of a simple setup made of basic electronics found around the lab in recording audio without special circuitry, and also how digital signal processing techniques can help with improving the audio obtained.
Team Members
A0166927N | Marcus Low Zuo Wu
A0171267A | Nicholas Chong Jia Le
Methods and Requirements
Using a photodiode / array of photodiodes, we attempt to record audio by measuring the signal from a laser reflecting off a surface near the sound.
Due to the nature of the setup mentioned, we require a decently dim environment to minimise noise, a visible light laser (does not need to be high powered but needs to be decently collimated), an optical bench, a set of photodiodes that can detect the laser light and produce a signal, and an electronic setup that allows us to capture and export the signal from the photodiodes.
Background
Level (logarithmic quantity)
A power level is a logarithmic quantity used to measure power, power density or sometimes energy, with commonly used unit decibel (dB).
Power level
Level of a power quantity, denoted LP, is defined by

where
- P is the power quantity;
- P0 is the reference value of P.
Field (or root-power) level
The level of a root-power quantity (also known as a field quantity), denoted LF, is defined by

where
- F is the root-power quantity, proportional to the square root of power quantity;
- F0 is the reference value of F.
Low-pass filter

A low-pass filter is a filter that passes frequencies lower than a selected cutoff frequency and attenuates signals with frequencies higher than the cutoff. Low-pass filters provide a smoother form of a signal, removing the short-term fluctuations and leaving the longer-term trend.
RC filter
The cutoff frequency of a passive first order low-pass filter is given by

where is the value of the resistance and is the value of the capacitance.


The top circuit on the right shows a configuration that forms such a low-pass filter. As seen on the bottom circuit on the right, higher order passive filters can be made simply by chaining together lower order filters. One issue with using a physical filter is that it adds a load to the circuit, and for higher order filters, the final output signal has a greatly decreased magnitude compared to the pure signal obtained from the photodiode. This would require the addition of amplifiers to our circuit, increasing its complexity. Additionally, from observation, the noise introduced in the connection to the oscilloscope along with electrical noise picked up by the wires is significantly greater than the noise in the signal from the photodiode itself, making an external low-pass filter performing noise filtering on the photodiode output not very effective.
As such, digital signal processing will be done instead for noise filtering. Butterworth filters specifically will be used in this work in order to minimise distortion introduced into the input.
Butterworth Filter
The Butterworth filter is a signal processing filter that is designed to have a uniform sensitivity in the passband ("desired" frequencies), while having a sufficient rejection in the stopband ("unwanted" frequencies)[3].
The (power) gain of such a filter, with a cutoff frequency and filter order is given by:


The gain curves for various orders of low-pass Butterworth filters are shown in the plot below, showing a roll-off of dB/decade of frequency. The roll-off at the cutoff frequency also gets sharper (roll-off starts closer to the cutoff frequency as opposed to slightly before ) as the order of the filter increases, as can be seen in the zoomed in plot below.

-
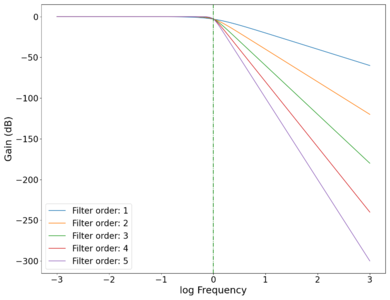 Plot of the (power) gain of low-pass Butterworth filters of different orders with cutoff frequency , showing the increasing rate of frequency rejection as the order of the filters increase.
 -
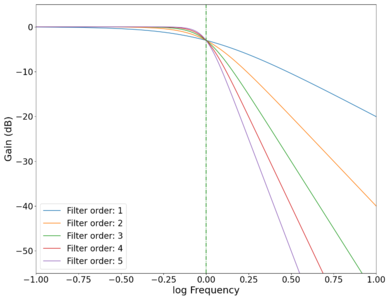 Plot of the different order low-pass Butterworth filters with the cutoff point magnified, showing increasing sharpness and precision in the cutoff behaviour as the order of the filters increase.


References
- ↑ "Generational Wi-Fi® User Guide". www.wi-fi.org. October 2018.
- ↑ Bluetooth Core Specification Version 5.3 Feature Enhancements. www.bluetooth.com. June 2021.
- ↑ S. Butterworth, "On the Theory of Filter Amplifiers," Experimental Wireless and the Wireless Engineer, Vol. 7, 1930, pp. 536-541