Schlieren Imaging: Difference between revisions
| Line 93: | Line 93: | ||
[[File: picture00005.png|600px|center|thumb|Fig.Before filtering and after]] | [[File: picture00005.png|600px|center|thumb|Fig.Before filtering and after]] | ||
Also, when we set both AOM modulation and sound wave frequency as 40kHz, we can find that the patterns around the knife-edge don't move. And when we tune the AOM frequency to 40.001kHz, we can find that the pattern starts to move by 1Hz frequency because of the frequency mismatch between the light and the sound wave. The same thing happened for 2Hz, 3Hz, 4Hz, and 5Hz mismatches. We can see the pattern moves quicker when the frequency mismatch increases. | |||
[[File: Video_laser.mp4|center]] | [[File: Video_laser.mp4|center]] | ||
Revision as of 10:54, 30 April 2022
Introduction
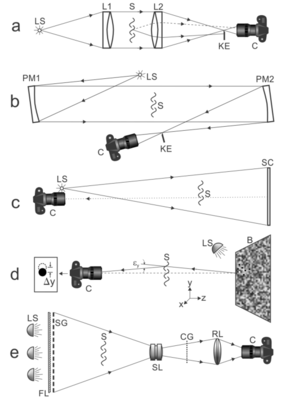
Schlieren is a method to observe the refractive disturbance of transparent media. It is formally originated by Robert Hooke in the 17th century. At the time it was invented, schlieren was once considered only a qualitative way of visualization. But nowadays, the quantitative usage of schlieren has become widespread in laboratories and industry. There exist several kinds of schlieren setup. But the basic idea is to convert the refraction index gradient with a knife-edge or pinhole.
Theory
There exist several kinds of schlieren setup. But the basic idea is to convert the refraction index gradient with a knife-edge or pinhole. Here we only give a representative analysis based on our setup shown below.
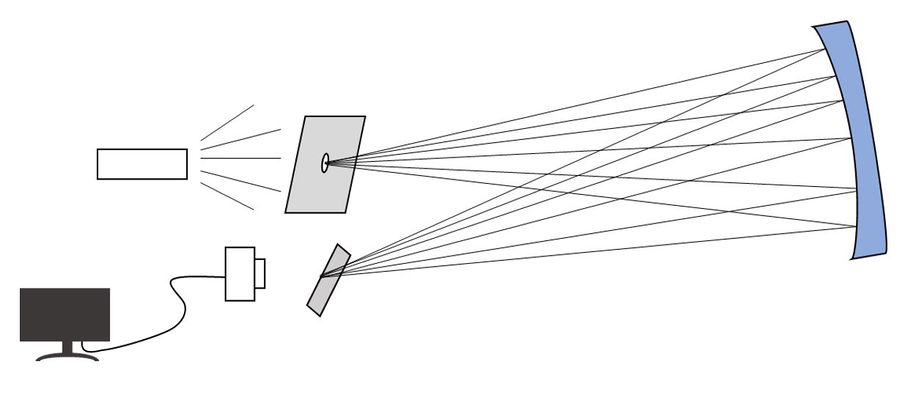
The light coming out from the pinhole is focused by the concave mirror. The position knife-edge is adjusted so that half of the focused light point is cut off. The light field is then recorded by a camera.
When the beam passes through an area with a refractive index, a small deflection occurs. Therefore, whether the corresponding part of the light field can pass the knife-edge gets changed. Only the deflection orthogonal to the knife-edge needs to be considered, which is written as:
In our experiment, the concave mirror is placed from both the light source and the knife-edge. The sample is placed right before the mirror. So the displacement of light on the knife-edge is . This will cause a brighter or darker area at the camera, depending on the direction of the refractive index. The relative change of brightness can be directly written as , compared to the input background. From the angle of Fourier Optics, the knife-edge acts as a spatial filtering component, while the concave mirror is a Fourier transformer. The filtered information in the frequency domain is reconstructed by the objective of the camera.
A known density distribution is needed to scale a schlieren setup. We picked an ultrasonic wave for its regular density distribution. A one-dimensional acoustic wave function writes:
The maximum pressure of sound is bounded by the input power Failed to parse (SVG (MathML can be enabled via browser plugin): Invalid response ("Math extension cannot connect to Restbase.") from server "https://wikimedia.org/api/rest_v1/":): {\displaystyle W=\frac{p_{max}^2 V}{2v^2\rho_0}} . Since the ultrasonic wave has a high frequency of around 40kHz, the state of air could be regarded as adiabatic expansion and compression, which follows Failed to parse (SVG (MathML can be enabled via browser plugin): Invalid response ("Math extension cannot connect to Restbase.") from server "https://wikimedia.org/api/rest_v1/":): {\displaystyle p\propto V^{-\gamma}} . The relationship between the refractive index and the compression of volume fits Gladstone–Dale relation:
where the density of fluid Failed to parse (SVG (MathML can be enabled via browser plugin): Invalid response ("Math extension cannot connect to Restbase.") from server "https://wikimedia.org/api/rest_v1/":): {\displaystyle \rho\propto V^{-1}} . Therefore, the refractive index distribution caused by an acoustic wave is easily calculated. The schlieren setup could be scaled by comparing the brightness of the image and the calculated density distribution. The thickness and volume of the sound area are fixed by using a standing wave setup. But either a standing wave or a traveling wave causes a fast-changing density oscillation, which flattens the fringes averaged within the time of shutter. Therefore, we used an acousto-optic modulator to produce a flashing light source to phase-lock with the sound wave.
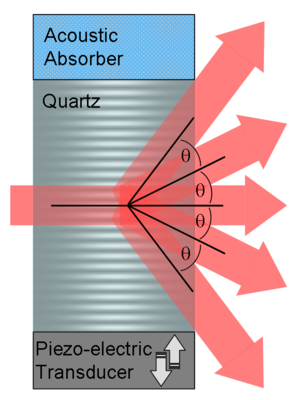
The acousto-optic modulator is driven by an 80MHz sound wave, the amplitude of which is switched on and off by a function generator at a 40kHz frequency. The laser is diffracted into several orders according to the grating equation Failed to parse (SVG (MathML can be enabled via browser plugin): Invalid response ("Math extension cannot connect to Restbase.") from server "https://wikimedia.org/api/rest_v1/":): {\displaystyle Asin\phi_k=k\lambda} . In such a method, the submaximal fringes could be used as a fast-flashing light source. However, the AOM asks for a highly coherent wave, this makes the image of schlieren less clear since interference happens in the field of view.
Experiment
Version 1
Setup structure and experiment process
The light source is a high-power LED that drives at about 3V 3A. There is an aperture in front of the led to block most of the light and make the source a point source. A concave mirror is located at 2f from the source. The concave mirror has a small angle to the instance beam. So the reflected light will go beside. There is a knife-edge at the reflection path about 2f from the concave mirror. Its function is to block half of the beam. A camera is located behind the knife edge to view the image.
The picture of the real setup looks like below. The concave mirror is on the left hand of the picture while the camera, knife-edge, and the source are on the right-hand side.
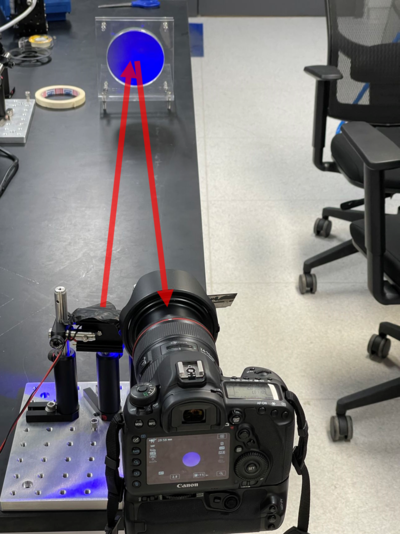
The source and the knife-edge are clearly shown below. A black cover is used to block the stray light so that it will not influence the imaging process as the light from the aperture is relatively too weak. There is a bright blue dot projected on the knife edge. That is half art of the minimum waist radius of the beam. So when the air density changes, the sharp pattern will move up and down and cause the image brighter or darker.
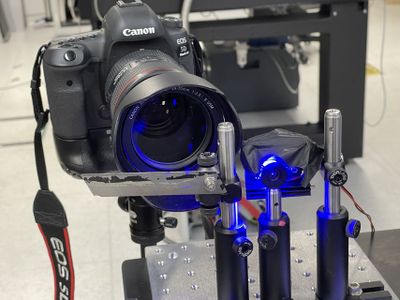
One thing that needs to be careful is not to let the knife-edge/camera be too far from the point source. Otherwise, the smallest wrist will not be round enough. It will come elliptically when the instance beam and the reflected beam are not overlapped very well. The elliptical shape of the beam can harm the resolution of the device.
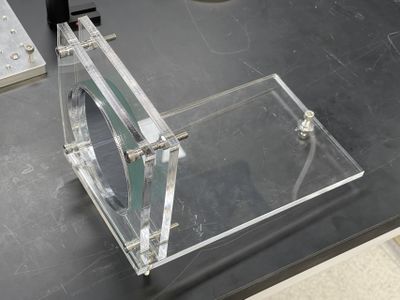
The huge concave mirror is clamped by two pieces of acrylic frame. The frame is pasted on a plate and there are three screws at the bottom of the plate to adjust the orientation and height of the mirror.
Measurement results of Version 1 setup
We first capture the airflow of a lighter flame.
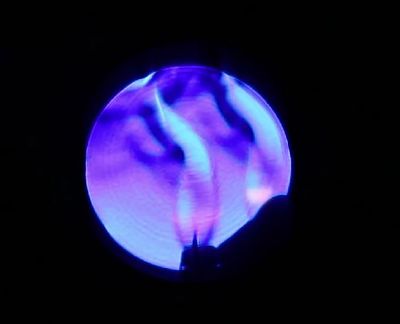
Below is a video of the flame.
We also shoot a video of the airflow from the hands due to temperature differences.
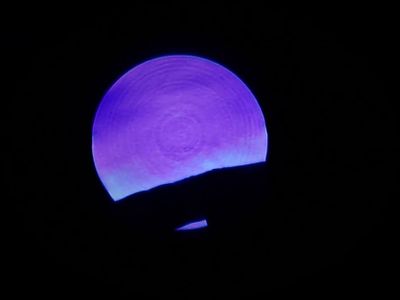
The bright part and the dark ripples are not as clear as the lighter one. The main reason is that the temperature contrast is not that high, so the light is weakly refracted. The video is also attached below.
The flow out from the mouth can also be seen.
Version 2
Setup structure and experiment process
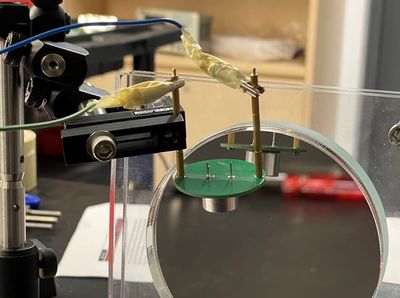
This is the ultrasound generator. The grey thing is a high-power speaker and the green plate is a circuit board for the speaker. And the speaker is connected to a function generator so the speaker can send sound at the corresponding frequency.
For capturing the sound, we need a high-frequency blinking light. Since the led can not work at 40kHz square wave voltage, we decided to use an independent modulator to shape the light to blinking mode. There is only an Acoustic Optics Modulator in our group at infrared wavelength, we replace the LED with a 650nm laser diode.
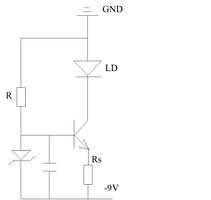
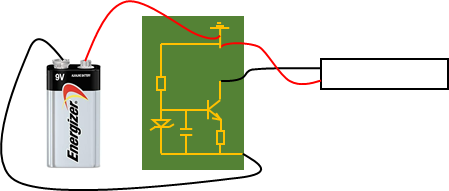
We use a homemade laser driving circuit to supply stable power to the 1mW laser diode. The diagram of the circuit is shown below, thanks to the help from Moe @CQT offering on the design.
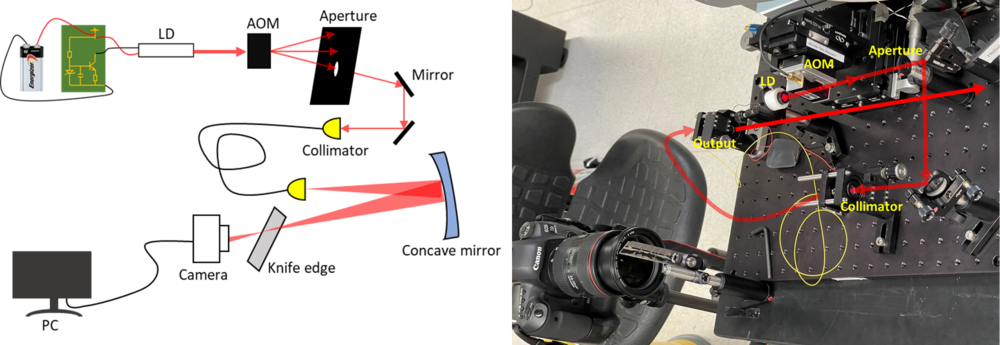
The light first goes through an acoustic modulator to chop the CW laser to a series of pulses. And then, an aperture is used to select the first-order diffraction pattern. Then, two gold mirror is included to adjust the angle and the height of the laser beam. A lens mounted on the cage system can focus the beam on the fiber tip so we can couple the light into a single-mode fiber. After passing through a short single-mode fiber, the output spatial mode will be relatively pure than before.
Two function generators are included, one is for the ultrasound generation. Another is to send a modulation signal to the acoustic optical modulator controller.
Measurement results of Version 1 setup
During the experimental process, we notice that the output mode of the laser diode is very dirty and almost impossible to image. So we include a short single-mode fiber at 650nm to filter the higher-order modes. Below is the imaging results before adding the fiber and after spatial mode filtering. We can find the image quality is greatly improved.
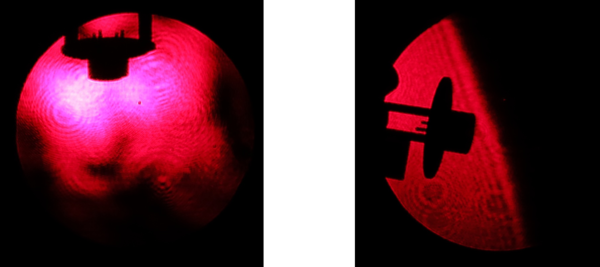
Also, when we set both AOM modulation and sound wave frequency as 40kHz, we can find that the patterns around the knife-edge don't move. And when we tune the AOM frequency to 40.001kHz, we can find that the pattern starts to move by 1Hz frequency because of the frequency mismatch between the light and the sound wave. The same thing happened for 2Hz, 3Hz, 4Hz, and 5Hz mismatches. We can see the pattern moves quicker when the frequency mismatch increases.
Result Analysis


Conclusion
A sensitive schlieren setup is established in this experiment. The schlieren is able to detect very small air density changes in daily life, such as the thermal convection around human skin, or a cup of coffee. We also tried to carry out a scale to calibrate the relationship between the brightness variation in the image and the refractive index gradient in space. However, the effect is highly limited by equipment. The size of the mirror bounds the choice of our sound wavelength. At the same time, usual light sources cannot offer a flashing frequency as high as 40kHz. So a laser source driven by the acousto-optical modulator has to be hired as the source. A short single-mode fiber is used to filter the distorted wavefront, and also works as a better point light source than the physical pinhole. But the coherence of the laser reduces the visibility of fringes badly.


