Resonance frequency measurement using a interferometric method
Team Members
Introduction
Interferometers since their invention have been a great tool for experimental physics. Applications cover a wide spectrum of fields such as astronomy, fiber optics, seismology, seismology, velocimetry to say the least. The precision of measurement of small displacements is the key factor, take LIGO as an example. Another important factor is the convenience to set up an interferometer and the low complexity in terms of equipment. In this experiment, we will measure the resonance frequency of a vibrating transducer using a Michelson interferometer. Basically, a transducer is attached to one optical path, to one mirror, of the Michelson interferometer and it is expected to see a peak in the response curve for the resonance frequency of the transducer plus mirror.
Theory
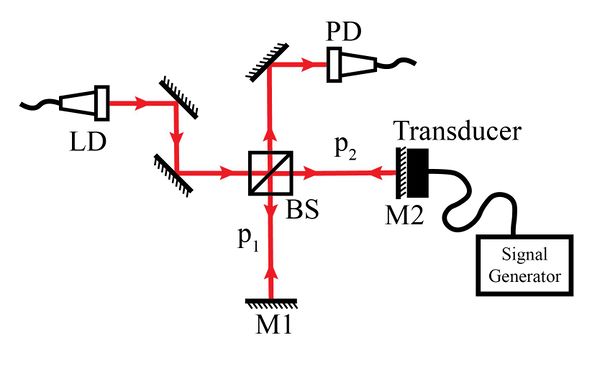
Our Michelson interferometer setup used a laser, a beam splitter, two mirrors, and a photometer, illustrated in Fig. 1. Original models used sodium flame as the coherent light source. The light propagates from the source to the beam splitter where approximately 50% of the incident light is transmitted and approximately 50% of it is reflected at a right angle. The transmitted light continues to propagate as the reference plane wave to the stationary mirror where it is fully reflected back towards the beam splitter. The reflected light propagates as the target plane wave to the mirror attached to the oscillating loudspeaker. The two waves then recombine at the beam splitter and interfere based on their relative phases based on the idea that the phase shift of the target plane wave varies with the instantaneous position of the speaker mirror combination. Consider a situation in which we setup our interferometer such that no phase shift corresponds to the equilibrium position of the speaker-mirror combination. At this position, we expect constructive interference at the photometer. Likewise, for every λ/2 change in displacement, we expect constructive interference at the photometer because the path length travelled by the target plane wave varies by some integral multiple of λ. Thus, the phase shift is an even multiple of π and the two waves remain in phase. Similarly, when the path length traveled is some odd multiple of λ/4, the phase shift is an odd multiple of π and the two waves interfere destructively.
Consider two coherent waves with the same amplitude A and same frequency that have paths and emitted from different sources that meet together at a point. The net wave at that point can then be given as the real part of the equation
where the wave number , is the wavelength of the waves, and c is the phase velocity. The time-averaged intensity of the combined wave is then proportional to the square of the its amplitude. That is,
where is a constant. Now suppose the mirror that the beam is incident to oscillates harmonically back and forth with a frequency Failed to parse (SVG (MathML can be enabled via browser plugin): Invalid response ("Math extension cannot connect to Restbase.") from server "https://wikimedia.org/api/rest_v1/":): {\displaystyle f} and a displacement Failed to parse (SVG (MathML can be enabled via browser plugin): Invalid response ("Math extension cannot connect to Restbase.") from server "https://wikimedia.org/api/rest_v1/":): {\displaystyle B} . Then, Failed to parse (SVG (MathML can be enabled via browser plugin): Invalid response ("Math extension cannot connect to Restbase.") from server "https://wikimedia.org/api/rest_v1/":): {\displaystyle p_2 =p_2(0)+Bsin(2\pi ft)} and the intensity of the detected light varies with time as
Failed to parse (SVG (MathML can be enabled via browser plugin): Invalid response ("Math extension cannot connect to Restbase.") from server "https://wikimedia.org/api/rest_v1/":): {\displaystyle I=A^2cos^2[2\pi(\frac{Bsin(2\pi ft)}{\lambda}-\theta')] }
Note that the frequency of oscillations is itself a sinusoid, meaning that there will be turnaround points in the oscillations.
Experimental setup
The Michelson interferometer consists of a beam splitter BS which is used to split the laser beam into two beams and two mirrors M1 and M2. The reflected beam goes to a fixed mirror M1 while the transmitted beam goes to the movable mirror M2. A transducer is attached to the mirror M2. The transducer is powered by a signal generator that is used to vary the vibrating frequency of the mirror. A photodiode PD is used to detect the signal of interference fringes. The schematic Michelson interferometer is shown in Figure 1.
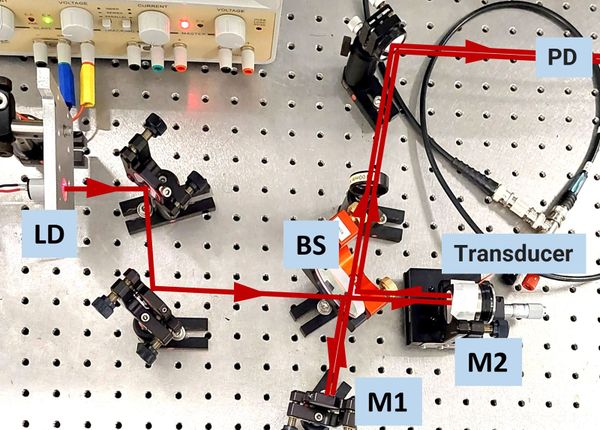
The experimental setup Michelson interferometer is shown in figure 2.
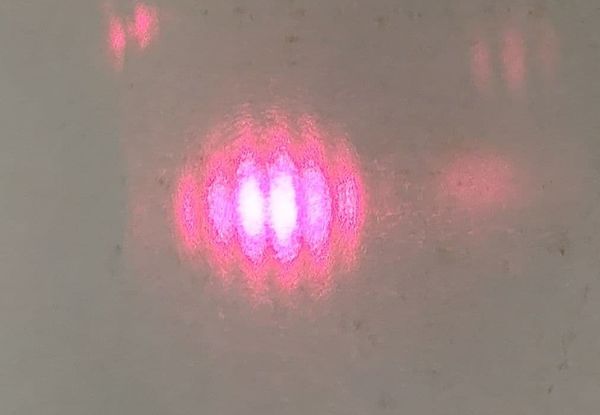
The interference fringes of the Michelson interferometer are observed when the transducer is turned off in Figure 3.
Experiment Results
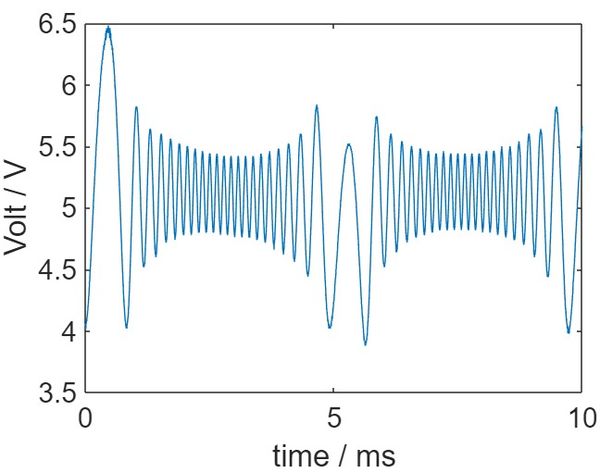
After the alignment of the optical setup, we applied sinusoidal voltage to the transducer attached to the mirror tightly. intensity fluctuation is recorded by the homemade photodiode. Data from the photodiode is collected by the oscilloscope. The typical figure from the oscilloscope is shown in Figure 4. According to the equation mentioned before, the number of peaks during each period corresponds to the radio of displacement and laser wavelength. In this case, we can measure the displacement for various frequencies. The frequency range is from 86 Hz to 130 Hz.
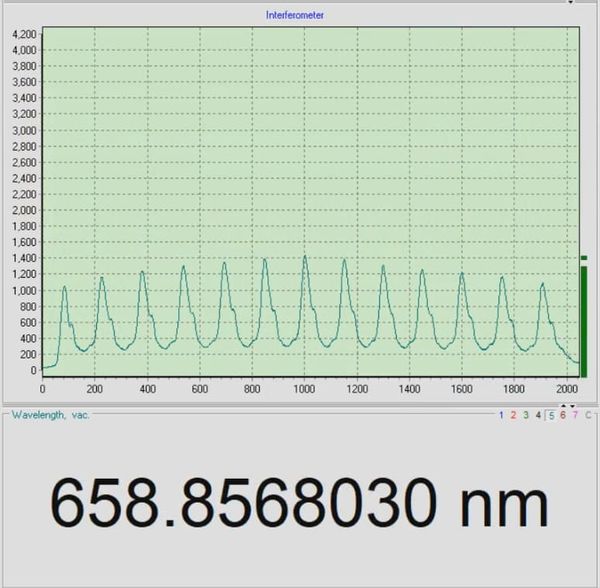
In our setup, we measured the wavelength of Mitsubishi Laser Diode which is 658.9 nm. The wavemeter measurement results are shown here.
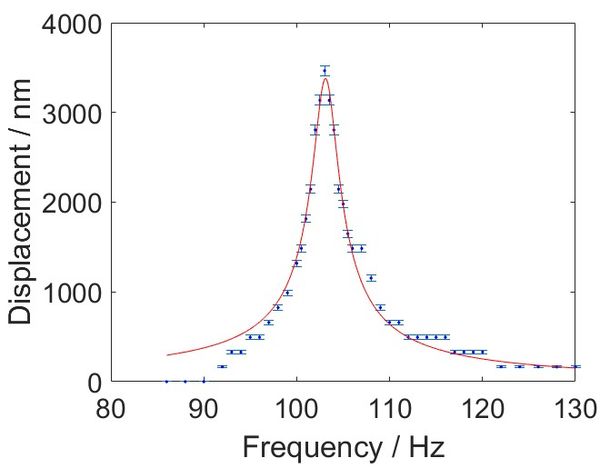
We plot the displacement for different frequencies with the errorbar in Figure 6. Uncertainty is the square root uncertainty of the count number. For a driven, damped and harmonic oscillator, the relation between displacement and frequency is
Failed to parse (SVG (MathML can be enabled via browser plugin): Invalid response ("Math extension cannot connect to Restbase.") from server "https://wikimedia.org/api/rest_v1/":): {\displaystyle |A|=\frac{f_{0}}{\sqrt{\left(\omega_{0}^{2}-\omega^{2}\right)^{2}+4 \beta^{2} \omega^{2}}} }
Where Failed to parse (SVG (MathML can be enabled via browser plugin): Invalid response ("Math extension cannot connect to Restbase.") from server "https://wikimedia.org/api/rest_v1/":): {\displaystyle f_{0}} is the amplitude, Failed to parse (SVG (MathML can be enabled via browser plugin): Invalid response ("Math extension cannot connect to Restbase.") from server "https://wikimedia.org/api/rest_v1/":): {\displaystyle \omega_{0}} is the resonance frequency, and Failed to parse (SVG (MathML can be enabled via browser plugin): Invalid response ("Math extension cannot connect to Restbase.") from server "https://wikimedia.org/api/rest_v1/":): {\displaystyle \beta_{0}} is a constant. With this equation, we can fit the frequency response curve. Because there is only one peak or valley for a frequency lower than 92 Hz or higher than 120 Hz, and the error is significant and non-negligible. We exclude those in the fitting process. Finally, the fitting root mean squared error (RMSE) is 130.38. Fitted Failed to parse (SVG (MathML can be enabled via browser plugin): Invalid response ("Math extension cannot connect to Restbase.") from server "https://wikimedia.org/api/rest_v1/":): {\displaystyle \beta} is Failed to parse (SVG (MathML can be enabled via browser plugin): Invalid response ("Math extension cannot connect to Restbase.") from server "https://wikimedia.org/api/rest_v1/":): {\displaystyle 1.3 \pm 0.2} . The fitting resonance frequency Failed to parse (SVG (MathML can be enabled via browser plugin): Invalid response ("Math extension cannot connect to Restbase.") from server "https://wikimedia.org/api/rest_v1/":): {\displaystyle \omega_{0} } is Failed to parse (SVG (MathML can be enabled via browser plugin): Invalid response ("Math extension cannot connect to Restbase.") from server "https://wikimedia.org/api/rest_v1/":): {\displaystyle 113.1 \pm 0.1Hz } .
Discussion
Our final result fits our data to the best Lorentzian Function. When we say best we talk about the function with the lowest Root Mean Square Error (RMSE).
RMSE is defined as follow:
Failed to parse (SVG (MathML can be enabled via browser plugin): Invalid response ("Math extension cannot connect to Restbase.") from server "https://wikimedia.org/api/rest_v1/":): {\displaystyle \operatorname{RMSE}=\sqrt{\frac{1}{n}\sum_{i=1}^n(A_i-\hat{A_i})^2}}
where Failed to parse (SVG (MathML can be enabled via browser plugin): Invalid response ("Math extension cannot connect to Restbase.") from server "https://wikimedia.org/api/rest_v1/":): {\displaystyle A_i} is the measured displacement and Failed to parse (SVG (MathML can be enabled via browser plugin): Invalid response ("Math extension cannot connect to Restbase.") from server "https://wikimedia.org/api/rest_v1/":): {\displaystyle \hat{A_i}} is the predicted displacement by the function model. The core of this method is calculate the distant between the measured and predicted values and take the root mean of them.
The displacements (Failed to parse (SVG (MathML can be enabled via browser plugin): Invalid response ("Math extension cannot connect to Restbase.") from server "https://wikimedia.org/api/rest_v1/":): {\displaystyle A_i} ) we have measured are in the regimen of thousands and the error is ~100. This could be attribute to the response of the system to lower frequencies. However, for near resonance the model fits pretty well.
Conclusion
We have shown indeed that we can characterize the resonance frequency of a system. For this particular application, we found a frequency of 113.12Hz for the system transducer plus mirror. Finally, with appropriate handling, this technique could be implemented to characterize more sofisticated systems.
References
[1] Freschi, A. A., et al. "Laser interferometric characterization of a vibrating speaker system." American Journal of Physics 71.11 (2003): 1121-1126. https://doi.org/10.1119/1.1586262
[2] Skarha, Matthew. "Laser interferometric characterization for a vibrating speaker system." http://mattskarha.com/assets/docs/Laser%20interferometric%20characterization%20for%20a%20vibrating%20speaker%20system%20good.pdf
[3] Pathare, Shirish, and Vikrant Kurmude. "Low cost Michelson–Morley interferometer." Physics Education 51.6 (2016): 063001. https://doi.org/10.1088/0031-9120/51/6/063001


![{\displaystyle \psi =Ae^{i(kx_{1}-\omega t}+Ae^{i(kx_{2}-\omega t)}=Ae^{-i\omega t}e^{ik{\frac {(x_{1}+x_{2})}{2}}}[e^{ik{\frac {(x_{1}-x_{2})}{2}}}e^{-ik{\frac {(x_{1}-x_{2})}{2}}}]=2Acos[k({\frac {x_{1}-x_{2}}{2}})]e^{i[k{\frac {(x_{1}+x_{2})}{2}}-\omega t]}}](https://wikimedia.org/api/rest_v1/media/math/render/svg/bf89cb600a038013b704bc38a2d7da7863d41adc)


![{\displaystyle I\propto cos^{2}[\pi ({\frac {p_{2}-p_{1}}{\lambda }})]=cos^{2}[2\pi ({\frac {p_{2}}{\lambda }}-\theta )]}](https://wikimedia.org/api/rest_v1/media/math/render/svg/7600807544b0691f0c5e342fe8d3104cff49a6fd)

