Smoke detection in air
Introduction
Smoke detector is a device that senses smoke, typically as an indicator of fire. Commercial smoke detectors issue a signal to a fire alarm control panel as part of a fire alarm system. Household smoke detectors, also known as smoke alarms, generally issue an audible or visual alarm from the detector itself or several detectors if there are multiple devices interlinked [1].
In this experiment, we use a photodiode and lock-in amplifier to detect and amplify the signal of light scattering in the air.
Lock-In Amplifier
Lock-in amplifier is a type of amplifier that can extract a signal with a known carrier wave from an extremely noisy environment[2].
It is very useful to amplify small signals in a large background (huge noise).
In this experiment, we will use a lock-in amplifier to amplify the scattering LED light signal in the air.
Multiplication of signals
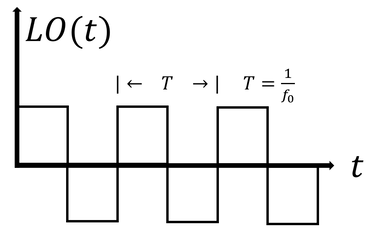
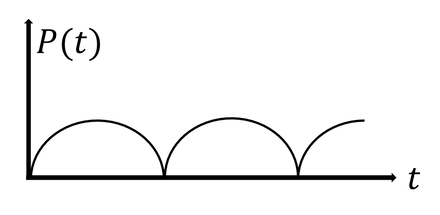
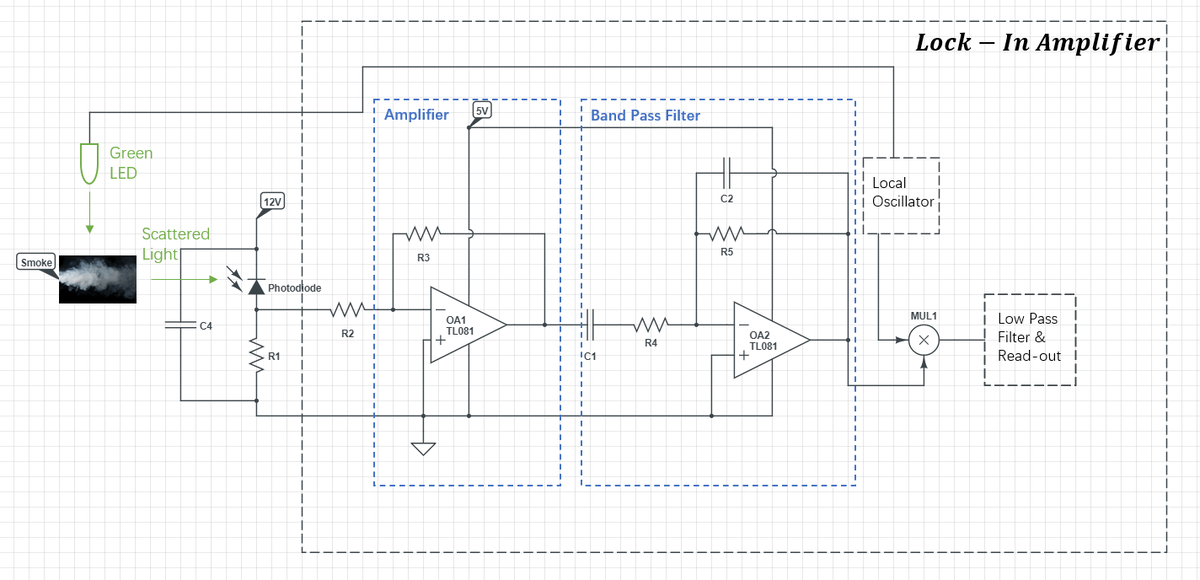
Assume that the reference signal of the LED is generated by a local oscillator, which is shown as below. When the reference signal and detection signal with same frequency are multiplied, the output becomes:
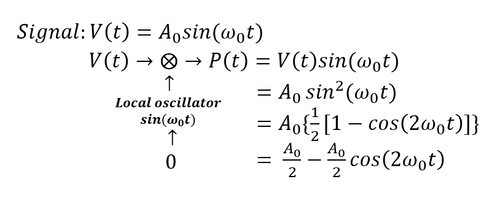
After integration over a time much longer than the period of the function, the result is equal to half of the product of the amplitudes.
But when the frequency of detection signal is different from the reference signal, the output is:
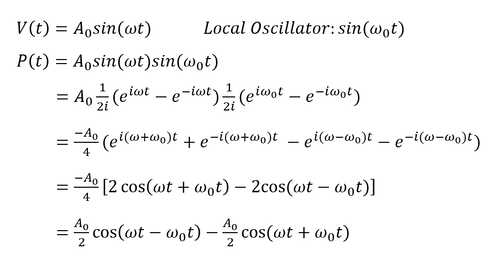
After integration over a time much longer than the period of the two functions, the result is zero.
Filtering
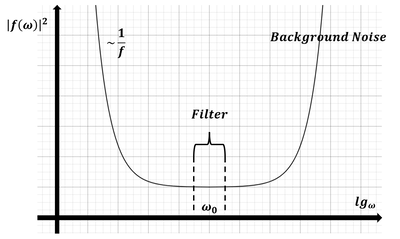
After the multiplication and integration, the pass filter is applied to reduce the noise in the environment.
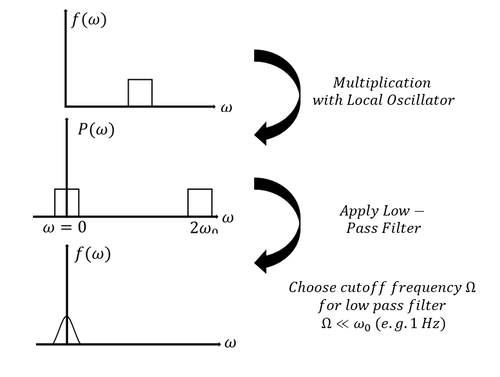
Flow Chart
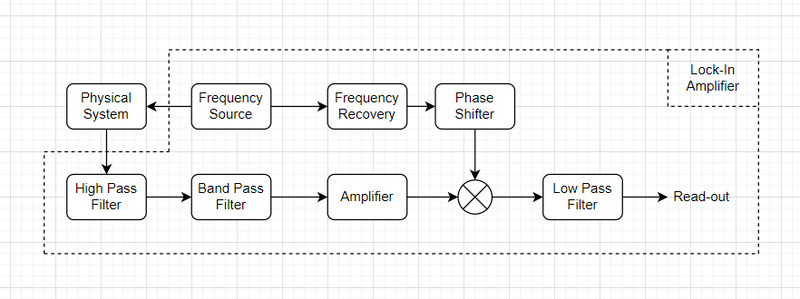
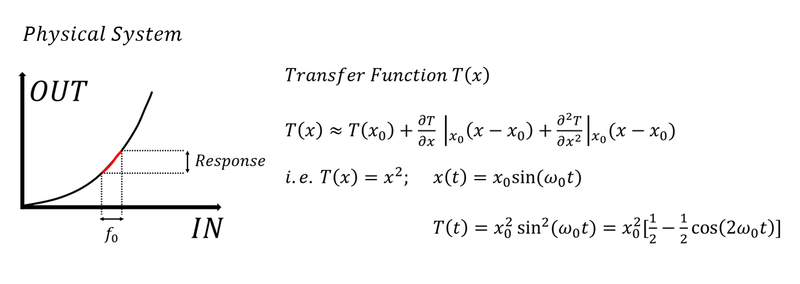
Experiment
We can divide this experimental setup into two parts: the first part will detect the scattering light in the air, and the second part will amplify such signal.
Laboratory Equipment
- Rubber Pipe (with two holes and black paint inside)
- 3D Printed Pipe (for assembly with the rubber tube)
- DC Voltage Source (MATRIX MODEL: MPS-3005L-3)
- MODEL SR830 DSP Lock-In Amplifier
- BWP34 Silicon PIN Photodiode
- WAVESURFER 104MXS Oscillator
- Capacitor (50V 22uF)
- Soldering Iron Kit
- Resistor (1.2K)
- LED (Green)
Schematics
Rubber Tube

Rubber tube with two holes at a ninety degree angle

3D printed tube
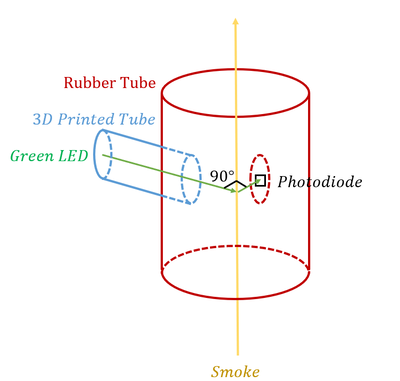
Structure for the smoke passage
The purpose of the 3D printed tube is to avoid direct light on the detector.
Detection Setup
We use BWP34 Silicon PIN Photodiode as the detector. The capacitor, resistor, DC power, and photodiode are connected to the breadboard. Then we can connect the output of the detector to the amplifier.
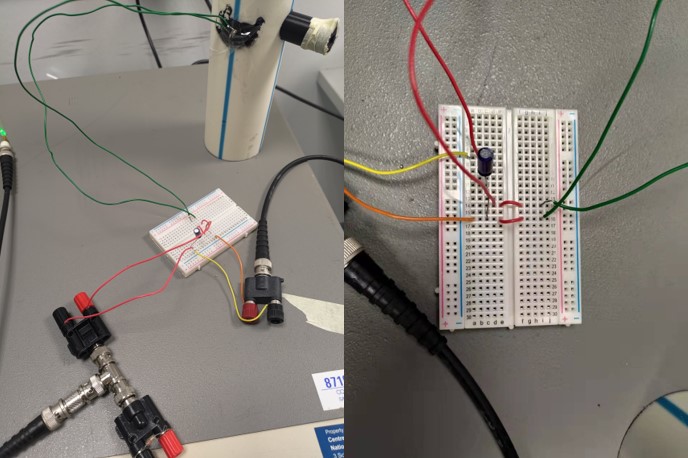
Lock-In Amplifier Setup
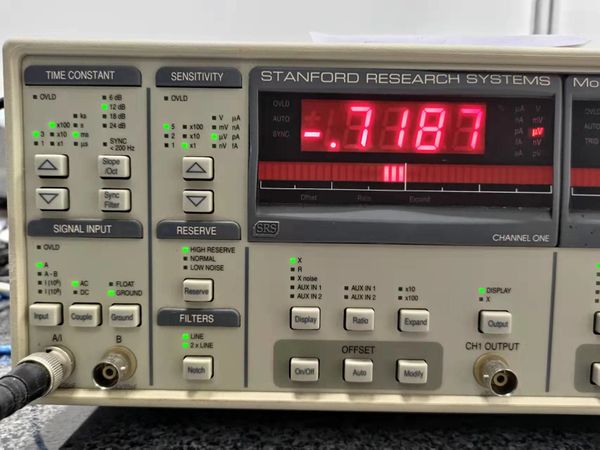
- Time Constant: pass filter 300ms
- Sensitivity: adjust it to improve sensitivity or reduce noise
- Input: AC-Ground; connect to photodetector and create DC current
- Filters: for filtering environmental light (line block 50 Hz; 2x block 100 Hz)
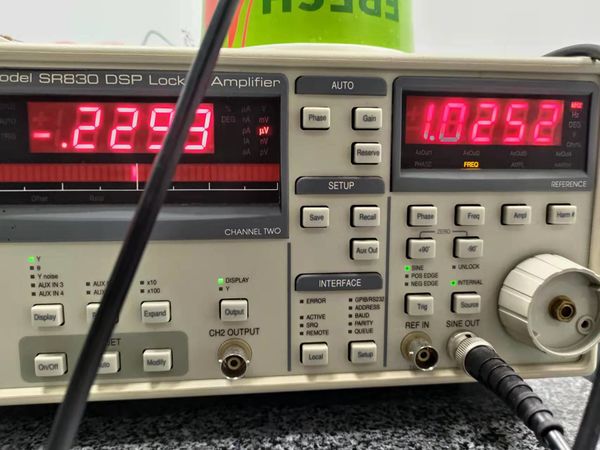
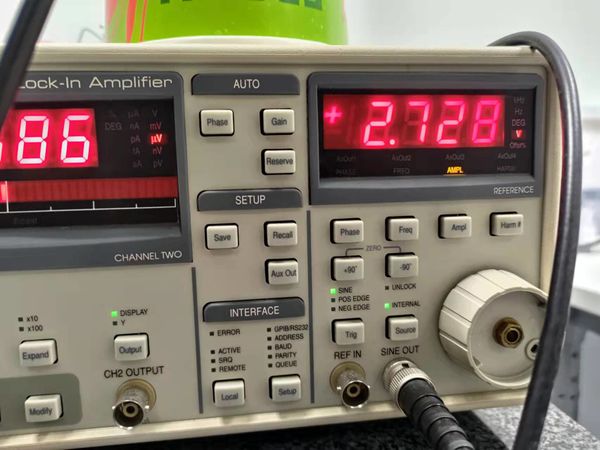
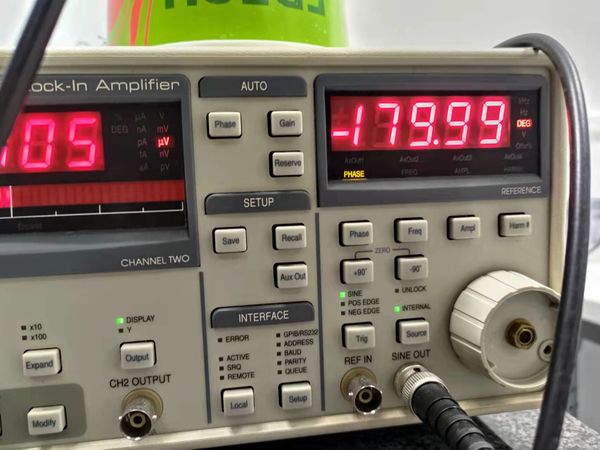
- Reference: input (control) is the connection to local oscillator; output (1 kHz frequency, sine wave, -180 degree phase) connects LED (2.7V)
Experiment Procedure
- Connect the circuit and put the LED and photodiode inside the rubber tube
- Turn on the lock-in amplifier and adjust it as the previous setup
- Turn on the voltage supply (10V) for the photodetector
- Connect the oscillator which is ready to record signal
- Use the soldering iron to create vaporized tin and let it drift into the pipe
- Adjust the sensitivity of the lock-in amplifier and record the data in oscillator
Video
In this video Media:SMOKE_VIDEO.mp4, we have recorded the voltage change in the lock-in amplifier under the situation when the smoke (vaporised tin) gradually drifts in, maintains and finally disappears.
Data Plot

The voltage variation in the lock-in amplifier
According to the signal, we can find that the voltage magnitude is related to the smoke. When smoke is absent, the magnitude is about -0.2V. With the presence of smoke, the magnitude drops to around -4V, and it goes back to about -0.4V when the smoke disappears. Using this set up, we can detect the appearance of smoke by observing the output of the lock-in amplifier, which means the smoke detector is successfully built.
Error Analysis
- From -127.2s to -58.1s, there is no smoke. The signal from lock-in amplifier is V1=-0.242±0.192V
- From -58.1s to -36.5s, the smoke went into the pipe, the amplitude raised in this period.
- From -36.5s to 30.2s, the signal from lock-in amplifier is V2=-4.233±1.192V
- From 30.2s to 38.8s, the smoke is removed from the pipe and the signal is reduced.
- From 38.8s to 72.8s, the signal from lock-in amplifier is V3=-0.434±0.242V
In this experiment we use the variance as the uncertainty of the signal. The uncertainty is significantly larger in smoke condition, this could be due to the unevenness of the smoke.
Conclusion
Conclusion on Result
From the data we can conclude that the smoke detector works well since we can clearly distinguish the presence (≈ -4 volt) or absence (≈ -0.2 volt) of smoke.
Further Discussion
Due to lack of measurement means and smoke with wide range of particle sizes, our group could not quantify the smoke and calculate the accuracy of the smoke detector. However, we have a rough idea:
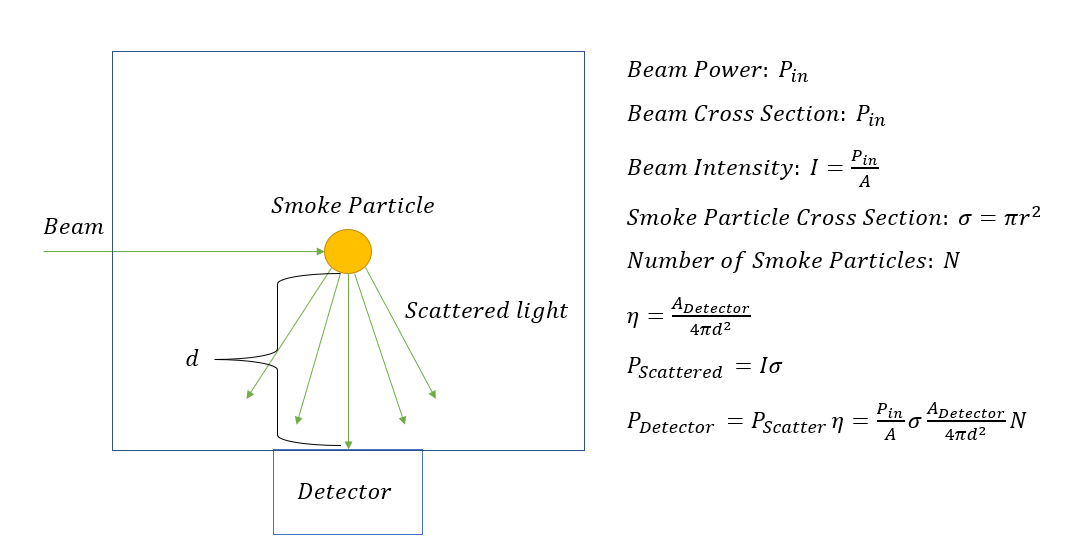
Based on this, if we can measure the particle size & number, we can quantize the response of the smoke detector and calculate its sensitivity.
Reference
Error Analysis in Experimental Physical Science: https://faraday.physics.utoronto.ca/PVB/Harrison/ErrorAnalysis/ErrorInMean.html
