Unused files
Jump to navigation
Jump to search
The following files exist but are not embedded in any page. Please note that other websites may link to a file with a direct URL, and so may still be listed here despite being in active use.
Showing below up to 50 results in range #1 to #50.
-
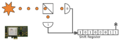
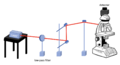
 Simulationtopview.png 624 × 203; 41 KB
-
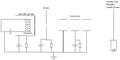 Schematic.png 1,124 × 559; 29 KB
-
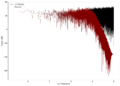 NMLMwhite filtered 3 1000Hz.png 1,400 × 1,000; 105 KB
-
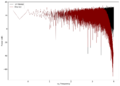 NMLMwhite filtered 3 4000Hz.png 1,400 × 1,000; 105 KB
-
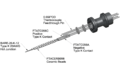 Thermocouple connection example.png 1,088 × 682; 358 KB
-
 Results03 02 ledvoltage.png 720 × 360; 42 KB
-
 Results03 03 darkcounts.png 720 × 720; 50 KB
-
 Results03 04 led voltage.png 720 × 720; 77 KB
-
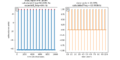
 Results03 05 averaged crosssection of data.png 1,080 × 360; 76 KB
-
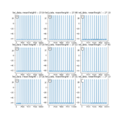
 Results03 06 ledvoltagelevels selection.png 3,000 × 750; 509 KB
-
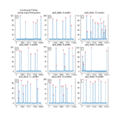
 Results03 07 distribution of peaks.png 2,250 × 1,500; 453 KB
-
 WeChat7f083c000c217b276a91e43dbb2e62cf.png 1,312 × 984; 300 KB
-
 General principle of QRNG.png 1,000 × 350; 173 KB
-
 NMLMAM.gif 600 × 450; 5.8 MB
-
 NMLMsetup original.png 1,280 × 720; 44 KB
-
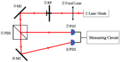 Schematic of setup.png 1,370 × 704; 76 KB
-
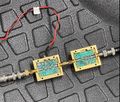 Setup of gain block and hign pass filter.jpeg 1,507 × 1,278; 604 KB
-
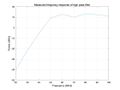 Graph of measured high pass filter frequency response.jpg 1,120 × 840; 49 KB
-
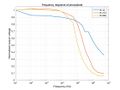 Graph of frequency response of photodiode.jpg 1,120 × 840; 108 KB
-
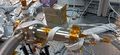 Bake1.jpeg 2,772 × 1,280; 513 KB
-
 截屏2022-04-26 下午3.11.05.png 1,616 × 872; 687 KB
-
 Confocal Microscopy.png 1,616 × 872; 687 KB
-
 Wiki.png 1,616 × 872; 687 KB
-
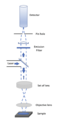 Fig 2.png 586 × 1,216; 255 KB
-
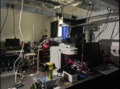 Fig 6.png 2,000 × 1,488; 5.31 MB
-
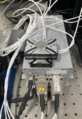 Fig 4.png 1,016 × 1,480; 2.9 MB
-
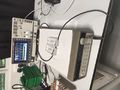 Dso jitter setup.jpeg 4,000 × 3,000; 4.48 MB
-
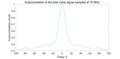
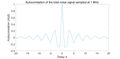
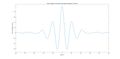 Autocorrelation of the total noise signal sampled at 1.25 GHz.jpeg 1,920 × 937; 66 KB
-
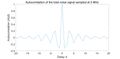
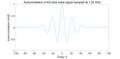 Autocorrelation of the total noise signal sampled at 1.25 GHz 2.jpeg 1,920 × 937; 86 KB
-
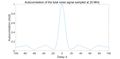
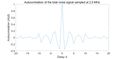
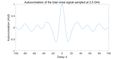 Autocorrelation of the total noise signal sampled at 2.5 GHz.jpeg 1,920 × 937; 86 KB
-
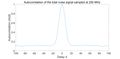 Autocorrelation of the total noise signal sampled at 250 MHz.jpeg 1,920 × 937; 82 KB
-
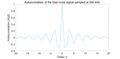
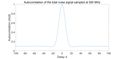 Autocorrelation of the total noise signal sampled at 500 MHz.jpeg 1,920 × 937; 81 KB
-
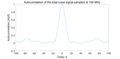 Autocorrelation of the total noise signal sampled at 100 MHz.jpeg 1,920 × 937; 84 KB
-
 Autocorrelation of the total noise signal sampled at 50 MHz.jpeg 1,920 × 937; 86 KB
-
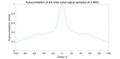
 Autocorrelation of the total noise signal sampled at 10 MHz.jpeg 1,920 × 937; 85 KB
-
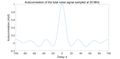
 Autocorrelation of the total noise signal sampled at 25 MHz.jpeg 1,920 × 937; 84 KB
-
 Autocorrelation of the total noise signal sampled at 5 MHz.jpeg 1,920 × 937; 81 KB
-
 HomodyneDetection BlockedVIncident.mp4 ; 1.25 MB
-
HomodyneDetection VoltageTapping.mp4 ; 3.19 MB
-
-
-
-
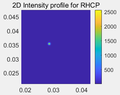
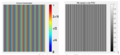
 Two-dimensional light intensity distribution and its stereogram.png 703 × 307; 48 KB
-
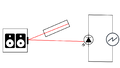
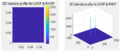
 Plasma-schematics.png 1,340 × 819; 61 KB
-
 Whole real setup.jpeg 1,706 × 1,278; 196 KB
-
 Source setup1.jpeg 1,706 × 1,278; 207 KB
-
 500 kHz (-20,20) After Highpass.jpg 1,920 × 937; 87 KB
-
 2.5 MHz (-20,20) After Highpass.jpg 1,920 × 937; 88 KB
-
 1 MHz (-20,20) After Highpass.jpg 1,920 × 937; 87 KB
-
 5 MHz (-20,20) After Highpass.jpg 1,920 × 937; 87 KB


_After_Highpass.jpg)
_After_Highpass.jpg)
_After_Highpass.jpg)
_After_Highpass.jpg)